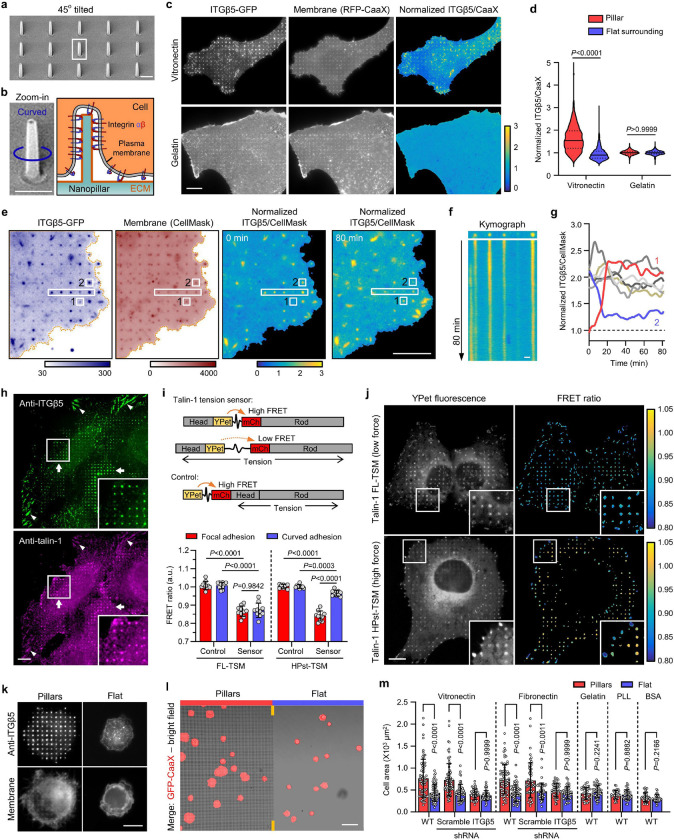
Fig. 2. Curved adhesions recruit talin-1 and bear low mechanical forces.
a, An SEM image of nanopillars. b, Left: Zoom in on a single nanopillar in a. Right: Schematic of integrin adhesion at a nanopillar. c, Fluorescence images showing that vitronectin-coated but not gelatin-coated nanopillars induce ITGβ5-GFP accumulations relative to membrane marker RFP-CaaX. Ratiometric images are shown in the Parula colour scale. d, Quantifications of the normalized ITGβ5/CaaX ratio at individual nanopillars and their flat surrounding regions on substrates coated with vitronectin (N= 926 pillars) or gelatin (N = 863 pillars). Medians (lines) and quartiles (dotted lines) are shown. e, Live cell imaging of ITGβ5-GFP and RFP-CaaX on vitronectin-coated nanopillar substrate at 15 s/frame for 80 min. Ratiometric images are shown at 0 min and 80 min. f, Kymograph of the rectangular box of e showing the dynamic of curved adhesions at 4 nanopillars. g, Example trajectories of ITGβ5 accumulation at nanopillar locations show that most curved adhesions persist, with a few showing slow assembly (pillar 1) or disassembly (pillar 2). h, On vitronectin-coated substrates, endogenous ITGβ5 and talin-1 colocalize in both curved adhesions at nanopillars (arrow) and focal adhesions between nanopillars or on flat areas (arrow heads). i, Top: Schematic of talin-1 tension sensors. Bottom: Quantification of the average FRET ratio at focal adhesions and curved adhesions from N = 10 cells for each condition. j, Fluorescence (YPet) and ratiometric FRET images (in Parula colour scale) of low-force FL-TSM sensor and high-force HPst-TSM sensor. In the zoom-in window of the HPst-TSM sensor, it is clear that curved adhesions exhibit higher FRET values, and thus lower tensions, than focal adhesions. k, ITGβ5 accumulates at vitronectin-coated nanopillars within 30 min after seeding. l, Early-stage cell spreading (30 min after plating) on vitronectin-coated nanopillar and flat areas in the same image. m, Quantification of the spreading area of N = 30–80 cells in each condition. Data are mean ± SD (i, m). P values calculated using Kruskal-Wallis test with Dunn’s multiple-comparison (d, m-vitronectin, fibronectin coatings), one-way analysis of variance (ANOVA) with Tukey’s multiple-comparison (i), Mann-Whitney test (m-Gelatin coating) or t-test (m-PLL, BSA coatings). Scale bars: 1 μm (a, b, f); 10 μm (c, e, h, j, k); 50 μm (l).

