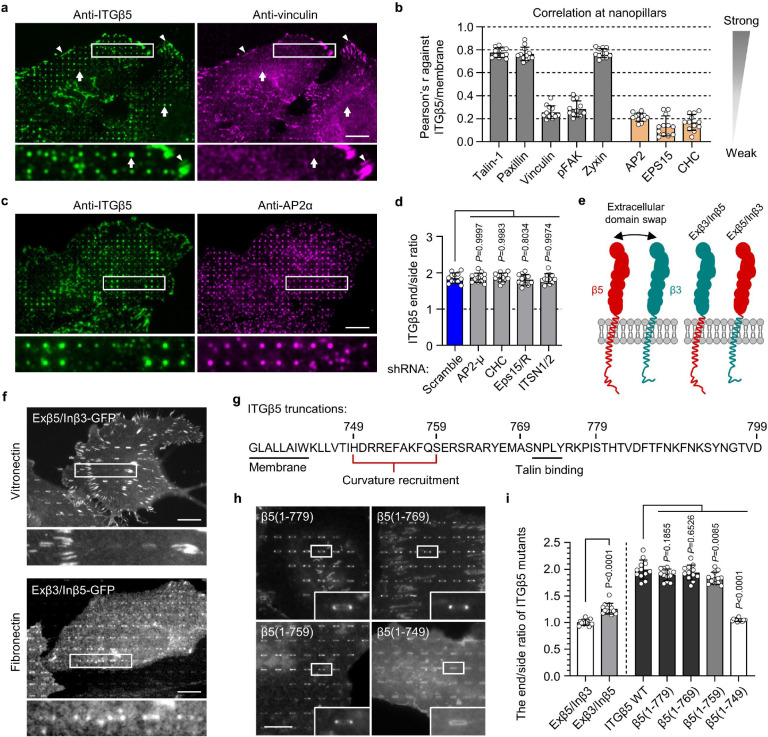
Fig. 3. Curved adhesions involve a subset of adhesion proteins and require the juxtamembrane region of ITGβ5 cytoplasmic domain.
a, Vinculin colocalizes with ITGβ5 in focal adhesions (arrow heads) on flat areas but is absent from curved adhesions (arrows) at nanopillars. b, Pearson correlation coefficients between ITGβ5 and focal adhesion proteins (grey bars) or between ITGβ5 and clathrin-mediated endocytic proteins (orange bars) at nanopillars. N = 12 cells for each condition with each cell represents the average of over 100 nanopillars. c, Both ITGβ5 and AP2-ɑ preferentially localize at nanopillars but their intensities are not correlated. Zoom-in images show that nanopillars with high AP2 intensities often have lower ITGβ5 intensities. d, Quantifications of ITGβ5 accumulation in curved adhesions (end/side ratio on nanobars) upon shRNA knockdown of different endocytic proteins. e, Illustration of the construction of chimeric Exβ5/Inβ3 and Exβ3/Inβ5 proteins. f, Exβ5/Inβ3 forms prominent focal adhesions but does not accumulate at the ends of nanobars, while Exβ3/Inβ5 shows curvature preference for nanobar ends. g, Sequence of the ITGβ5 cytoplasmic domain and the truncation sites. h, Fluorescence images of GFP-tagged ITGβ5 truncations (1–779), (1–769), (1–759), and (1–749) on vitronectin-coated nanobars. All truncations, except β5(1–749), show curvature preference for nanobar ends. i, Quantification of the curvature preferences of chimeric, wild type (WT), and truncated ITGβ5 by measuring their nanobar end/side ratio. N = 12 cells for each condition. Data are mean ± SD, from two independent experiments. P values calculated using one-way ANOVA with Bonferroni’s multiple-comparison (d, i-WT vs. truncations) or t-test (i-Exβ5/Inβ3 vs. Exβ3/Inβ5). Scale bars: 10 μm.

