
Figure 1. Remote neuronal stimulation accelerates glioma progression.
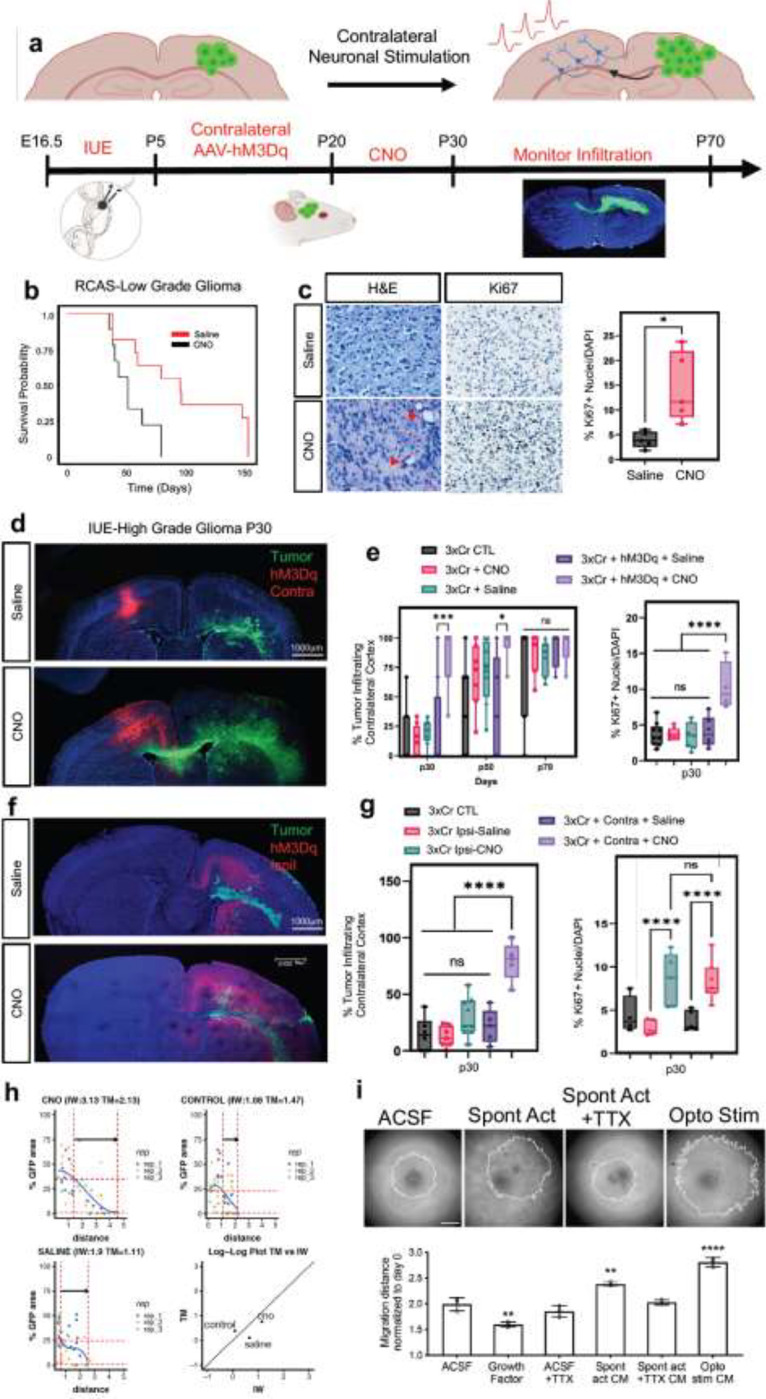
a. Schematic of DREADD-based activation of neurons contralateral to tumor in both RCAS-Ntva and IUE models. b. Kaplan-Meier survival analysis of RCAS-Ntva tumors treated with saline (medianSaline= 95 days, n = 11) or CNO (medianCNO = 51 days, n = 9) showing significantly faster morbidity in CNO treated RCAS tumors (Log-rank (Mantel-Cox) test, Chisq = 6.456, df = 1, p-value = 0.0111, CNO/Saline HRlog-rank= 2.768, 95% CI = 0.9770 to 7.945). c. H&E staining of RCAS-Ntva tumors samples revealed high grade characteristics in CNO treated tumor groups (red arrows). Ki67 staining proliferation in CNO treated mice versus saline treated mice. Quantification is derived from n=5 mice from CNO (mean = 14.51%, SD = 7.076%) and Saline (mean = 4.017%, SD = 2.179%) groups and determined by Welch’s unpaired t-test (p-value = 0.0276, t = 3.228, df = 4.441). d. Representative images from IUE-HGG tumors at P30 demonstrating infiltration; green is tumor, red is AAV-DREADD virus. e. Quantification of infiltration and Ki67 expression across the P30-P70 timecourse. Infiltration was quantified based on the presence of tumor cells in contralateral cortex and analyzed via two-way ANOVA; data derived from p30 CTL n = 8, p50 CTL n = 7, p70CTL n = 7, p30+CNO n = 8, p50+CNO n = 7, p70+CNO n = 7, p30+Saline n = 8, p50+Saline n = 7, p70+Saline n = 7, p30+AAV+Saline n = 8, p50+AAV+Saline n = 5, p30+AAV+Saline n = 4, p30+AAV+CNO n = 8, p50+AAV+CNO n = 6, p30+AAV+CNO n = 5 samples. Ki67 staining was performed at the p30 time point, from CTL n = 9, CNOonly n = 8, Salineonly n = 7, AAV+Saline n = 5, AAV+CNO n = 4 samples. f. Representative images from IUE-HGG tumors at P30 demonstrating the extent of infiltration after activation of neurons in the cortex ipsilateral to the tumor (CNO) and saline treated controls; green is tumor, red is AAV-DREADD virus. g. Quantification of tumor infiltration and Ki67 expression at P30 (3xCr CTL n = 5 mean = 4.329%, 3xCr+IpsilAAV+Saline n=5, mean = 2.975%, 3xCr+IpsilAAV+CNO n=5, mean = 8.144%). Significant difference was found in Ki67+ nuclei in ipsilateral CNO stimulated tumors vs saline control (p-value <0.0001) and vs 3xCr only controls (p-value = 0.0020); Infiltration was quantified based on the presence of tumor cells in contralateral cortex and analyzed via one-way ANOVA (3xCr CTL n = 6, 3xCr+IpsilAAV+Saline n=7, 3xCr+IpsilAAV+CNO n=9) with CNO stimulated brains showing no statistical difference to Saline treated (p-value = 0.0649) or control tumors (p-value = 0.1504). Direct comparison between ipsilateral-CNO and contralateral-CNO groups revealed a statistically significant difference (p-value <0.0001). h. Mathematical modeling of glioma infiltration as a function of tumor mass. Blue line is the smoothed data points using piecewise-cubic splines; red horizontal dashed lines are the 0.8 pmax and 0.02 pmax glioma cell density of the maximum smoothed cellular density (pmax ). Red vertical lines are the intersecting distance points of the red horizontal lines with smoothed blue line, which is used in calculating infiltrating width (IW). Black arrow shows the IW. Log-log plot shows the dependence of IW and tumor mass (TM). Analysis was performed at the p30 timepoint on CTL n = 3, Saline n = 3, CNO n = 3; samples from individual biological replicates are color coded. i. Glioma 3D spheroid migration assay, measuring glioma infiltration after treatment with growth factor media, conditioned media (CM) from spontaneously active cortical explants, spontaneously active cortical explants silenced with TTX (10μm) or optogenetically stimulated cortical explants (channelrhodopsin-2 (ChR2)-expressing deep layer cortical projection neurons), in comparison to ACSF control. Scale bar is 500μm. *P < 0.05, **P < 0.01, ***P < 0.001, **** P < 0.0001, log-rank(b), unpaired Welch’s t-test (c), two-way analysis of variance (ANOVA) (e), one-way analysis of variance (ANOVA) (c, e).