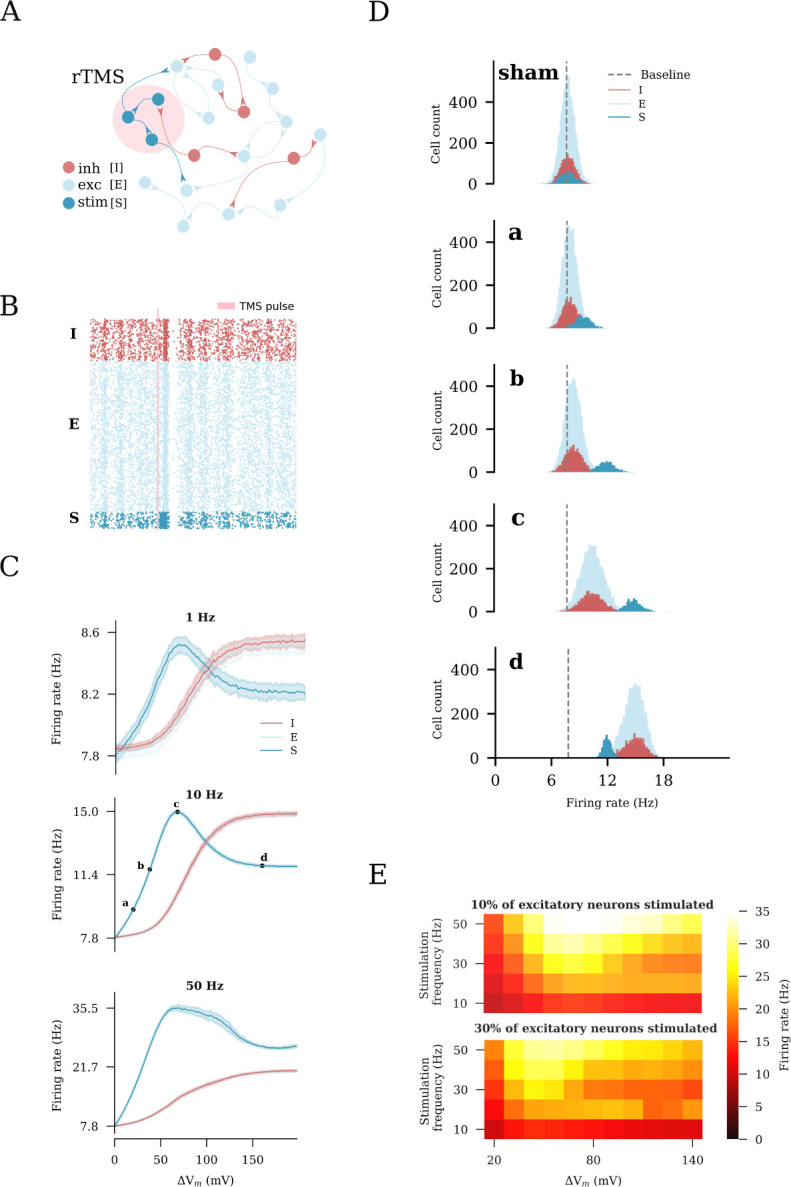
Fig 2. Repetitive transcranial magnetic stimulation (rTMS) changes network activity.

(A) Illustration of the recurrent neuronal network with sparsely connected excitatory [E] and inhibitory [I] neurons used in this study. A subset of excitatory neurons [S] is stimulated. (B) rTMS influences the asynchronous, irregular firing state of the stimulated neurons [S], causing them to fire in a synchronous manner. (C) Change in the average firing rate in response to distinct stimulation intensities and frequencies of 10% of excitatory neurons. Four intensities (a: weak, c: peak, d: strong, and b: strong-equivalent) were arbitrarily selected to represent different stimulation intensities. (D) Firing rate histograms for populations E, I, and S at stimulation intensities a, b, c, and d, respectively. (E) Heatmaps summarizing the results of rTMS of 10% (top) and 30% (bottom) of excitatory neurons.
