
Fig 4. rTMS intensity and pulse number affect the structural remodeling of stimulated networks.
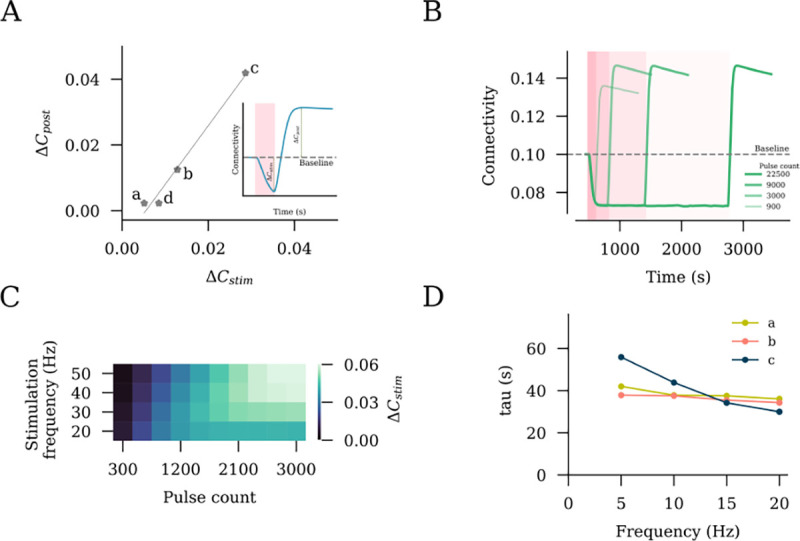
(A) Interrelation between the connectivity drop during stimulation and connectivity increase post stimulation . (B) Stimulation outcomes from different pulse numbers of 10 Hz stimulation at peak stimulation intensity (c, as defined in Fig 2C). (C) Saturation points, expressed as the total pulse numbers required, are summarized for a range of frequencies. (D) Time constants of connectivity decay were extracted by fitting an exponential function to stimulation connectivity drop among stimulated neurons (S–S).