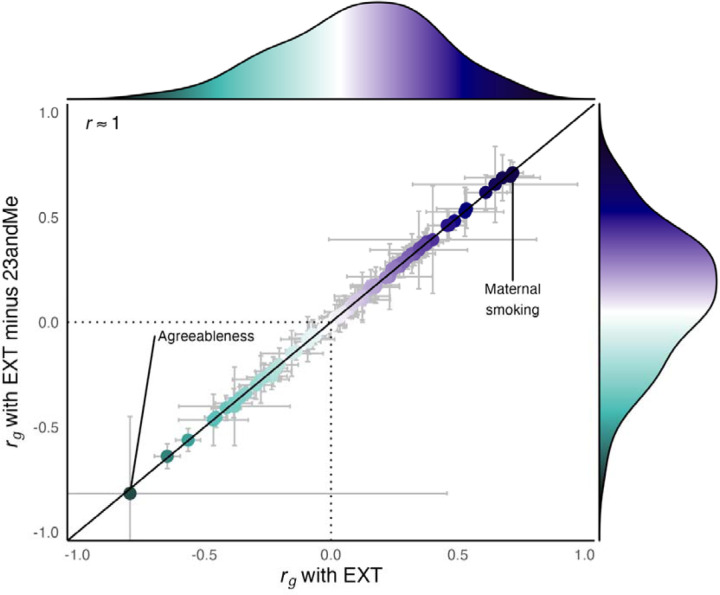
Fig 3.
Scatterplot of genetic correlations (rg) and marginal density plots between EXT (y-axis) or EXT-minus-23andMe (x-axis) with 77 other phenotypes. Each point corresponds to the genetic correlation coefficient with its 95% confidence intervals (rg ± 1.96 × SE) estimated with bivariate LD Score regression. Table S5 reports the estimates, their standard errors, and confidence intervals. The Spearman rank correlation reported in the figure is rounded from r = 0.9995. No particular shape, such as a normal distribution, is expected for the marginal density because the figure displays an arbitrary selection of traits.

