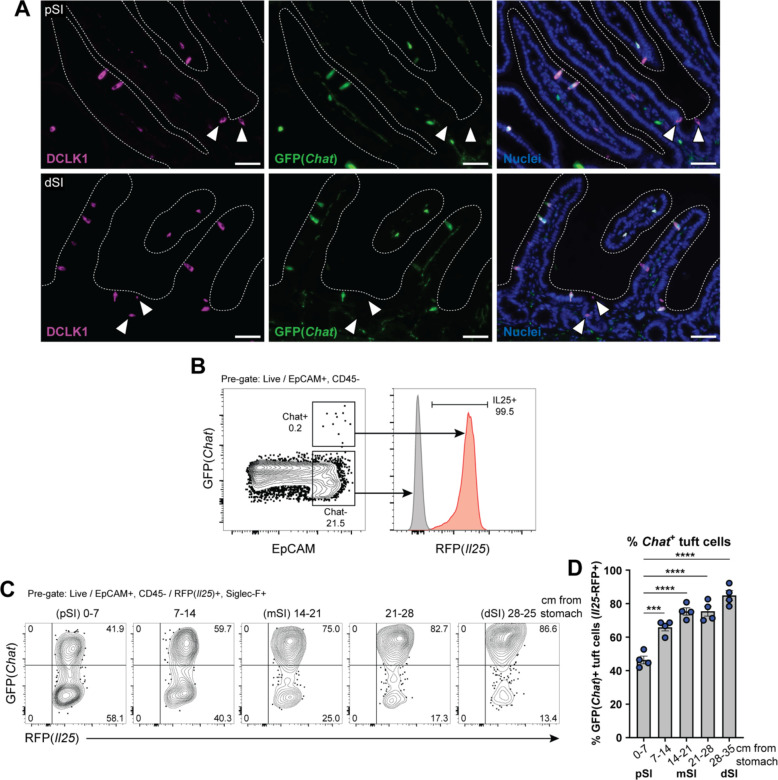
Figure 1: SI tuft cells express Chat in a proximal to distal gradient.
(A) Representative images of GFP(Chat) expression (green) by DCLK1+ tuft cells (magenta) in the proximal SI (pSI) and distal SI (dSI) by immunofluorescence. White arrows indicate GFP(Chat)- tuft cells. Nuclei stained with DAPI (blue). Scale bars: 50 μm (B) GFP+ epithelial cells (EpCAM+) are RFP(Il25)+ tuft cells. (C and D) (C) Representative flow cytometry and (D) quantification of the percentage of GFP+ tuft cells by sequential 7 cm section across the length of the SI. In D, each symbol represents an individual mouse (columns represent different tissues from same mouse) from three pooled experiments. *p < 0.05, **p < 0.01, ***p < 0.001 by one way ANOVA with Tukey’s multiple comparisons test (D). mSI, medial SI. Graphs depict mean +/− SEM. Also see Figure S1.

