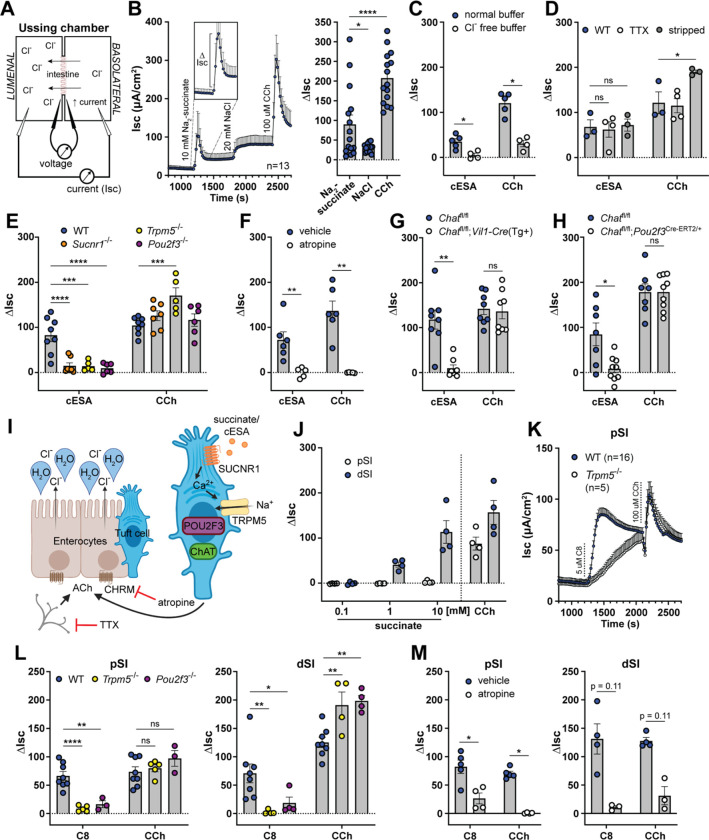
Figure 2: Tuft cell-derived ACh induces epithelial fluid secretion.
(A) Ussing chamber schematic. (B) Average Isc traces and quantification of the delta Isc (ΔIsc, see inset and bar graph) of WT dSI tissue stimulated as indicated (10 mM Na2-succinate and 20 mM NaCl, lumenal; 100 μM CCh, basolateral). (C) ΔIsc values of WT dSI in presence of normal chloride- (Cl−) containing buffer or buffer selectively lacking Cl−, stimulated as indicated (10 mM cESA, lumenal). (D) ΔIsc values of WT intact dSI compared to stripped dSI and dSI pretreated 15 min with TTX (1 μM, basolateral), stimulated as indicated. (E) DIsc values of dSI from mice of indicated genotypes stimulated as indicated. (F) ΔIsc values of WT dSI compared to dSI pretreated 15 min with pan-CHRM inhibitor atropine (10 μM, basolateral), stimulated as indicated. (G and H) ΔIsc values of dSI with (G) epithelial cell- (Vil1-Cre) and (H) tuft cell-specific (Pou2f3ERT2-Cre/+) Chat deletion, stimulated as indicated. (I) Model of tuft cell chemosensing of succinate driving ACh-dependent fluid secretion independent of neurons. (J) ΔIsc values of WT pSI and dSI stimulated as indicated. (K) Average Isc traces of pSI from WT or Trpm5−/− mice stimulated as indicated (5 μM C8, basolateral). (L and M) ΔIsc values of WT tissues compared to (L) tissues from indicated genotypes or (M) tissues pretreated 15 min with atropine (10 μM, basolateral), stimulated as indicated. In the graphs, each symbol represents an individual mouse (one tissue or average of two) pooled from two or more experiments. Groups represent sequential stimulations of the same tissue. *p < 0.05, **p < 0.01, ***p < 0.001, ****p < 0.001 by RM one way ANOVA with Tukey’s multiple comparisons test (B), two way ANOVA with Dunnett’s multiple comparisons test (D, E, L), multiple Mann-Whitney tests with Holm Sídák’s multiple comparisons test (C, F, G, H, M). ns, not significant. Graphs depict mean +/− SEM. Also see Figure S2.

