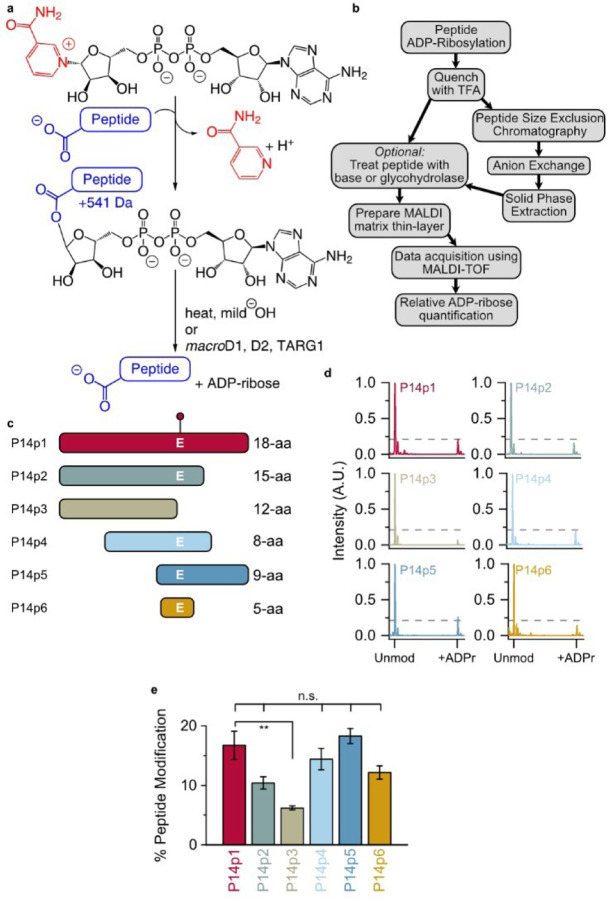
Figure 1.
Identification of a minimal P14 selective peptide sequence. (a) ADP-ribosylation (step 1) and hydrolysis reactions (step 2). (b) TLC-MALDI workflow. (c) Peptide truncations used in this study (full sequences in Figure S1). The E acceptor is indicated. (d) P14 and the indicated peptide were incubated in the presence of NAD+ and subjected to TLC-MALDI to visualize the resulting increase in m/z due to ADPr (+541 Da). The dashed line represents the intensity observed for ADP-ribosylation of P14p1. (e) MS spectra were integrated to determine the relative levels of ADP-ribosylation. The bar graphs depict the fraction of the total peptide that was modified (mean ± S.E.M., n = 3). ** represents p-value <0.01, two-tailed Student’s t test, n.s. represents a non-significant difference.

