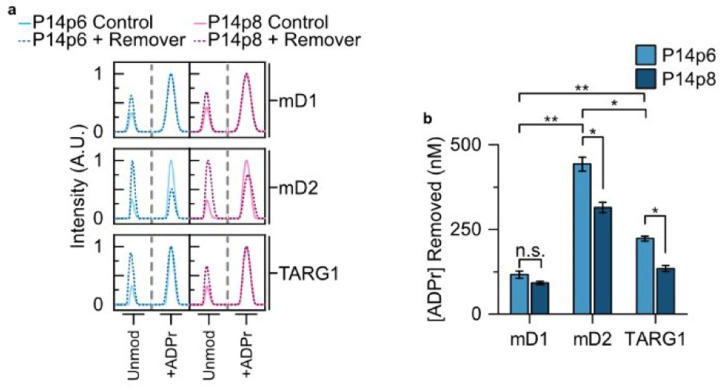
Figure 4.
ADPr glycohydrolases display differential preferences for P14 selective sequence motifs. (a) Synthesized ADPr—P14p6 or ADPr—P14p8 peptides (dashed lines) were incubated in the presence of either macroD1 (mD1), macroD2 (mD2), or TARG1 and subjected to TLC-MALDI to determine the relative levels of hydrolysis. Non-enzymatic controls (solid line) were utilized to ascertain the levels of background hydrolysis. The unmodified and modified peaks are shown for comparison. (b) MS spectra were integrated to determine the relative levels of ADPr hydrolysis. The bar graphs depict the amount of ADPr removal (mean ± S.E.M., n = 3). ** represents p-value <0.01, two-tailed Student’s t test, * represents a p-value <0.05, and n.s. represents a non-significant difference.

