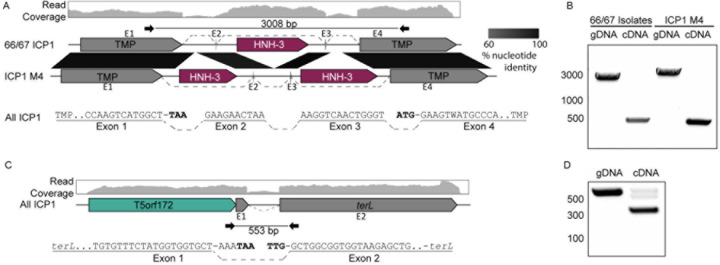
Figure 3. ICP1 isolates use conserved transcript splicing to express fragmented essential genes.
(A, C) Gene graphs representing the splicing architecture of the ICP1 tape measure (A) and large terminase (C) as detected by RNA sequencing and RT-PCR. 66 of the 67 ICP1 isolates share a similar architecture, with a single HNH-3 HEG between the two TMP fragments (Top gene graph). A single ICP1 isolate, ICP1_1992_M4 (ICP1 M4), encodes two intronic HNH-3 HEGs in the same locus, both unique from the HNH-3 HEG found in the majority of ICP1 isolates (bottom gene graph). Despite the considerable difference in intronic sequence, all ICP1 isolates undergo differential splicing to excise unique homing endonuclease genes from TMP transcripts (A), resulting in nearly identical TMP sequences. Percent nucleotide identity between the conserved sequences is indicated by the black parallelogram between the gene graphs. All ICP1 isolates share conserved splicing of the large terminase (terL) (C), which is neighbored by a T5orf172 HEG. RNA-seq read mapping of total RNA isolated from ICP1 2006_Dha_E (top read coverage graphs aligned to a gene graph of the TMP (A) or terminase (C) coding region) shows a distinct drop in reads in intronic regions compared to that of the exonic regions. The splice junctions of the exonic transcript are represented below the gene graph and exons are labeled E1–4 (TMP) or E1–2 (terL), with dashed lines representing sequences joined by splicing. Nucleotides highlighted in bold are the predicted start and stop codons of the annotated coding sequences on the gene graphs, which are removed during the splicing process.
(B, D) Agarose gels of PCR products generated following PCR across the splice sites of the TMP (B) or terL (D) sequence from gDNA and cDNA confirms splicing present in cDNA samples. Selected size markers from 2-Log DNA Ladder are indicated by the numbers to the left of the gels in base pairs, Sanger sequencing of cDNA products confirmed the exon mapping represented in (A) and (C). Black inward-facing arrows represent the primers used for both the cDNA and gDNA PCR reactions and the indicated size of the gDNA product is indicated in base pairs.

