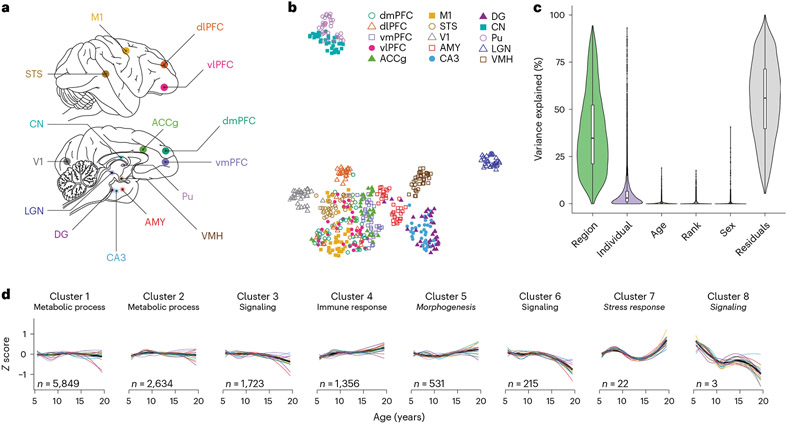
Fig. 1 ∣. Experimental design and global expression patterns.
a, Brain regions sampled (N = 15 regions); dmPFC, dorsomedial PFC; dlPFC, dorsolateral PFC; vmPFC, ventromedial PFC; vlPFC, ventrolateral PFC; ACCg, anterior cingulate cortex gyrus; M1, primary motor cortex; STS, superior temporal sulcus; V1, primary visual cortex; AMY, amygdala; CA3, cornu ammonis 3; DG, dentate gyrus; CN, caudate nucleus; Pu, putamen; LGN, lateral geniculate nucleus; VMH, ventromedial hypothalamus. b, UMAP plot reveals the latent structure among bulk tissue RNA-seq libraries driven primarily by brain region, with distinct separation of the striatum, thalamus, cerebral cortex and other subcortical regions (hippocampus, AMY and hypothalamus). c, Age explains a relatively small percentage (median = 0.19%) of global variation in gene expression across the brain (N = 527 biologically independent samples). Box plots depict the median (center) and interquartile range (IQR; bounds of the box), with whiskers extending to either the maxima/minima or to the median±1.5× IQR, whichever is nearest. d, Clustering by age changes reveals eight clusters of genes with distinct trajectories. Within each cluster, expression was averaged across all genes and summarized separately by region (thin lines, colored by region) and combined across regions (thick black line). Clusters are labeled with high-level biological processes enriched within each cluster (see Supplementary Table 4 for detailed results), with italics indicating that the top processes did not pass a significance threshold (FDR < 0.2). The number of genes (n) assigned to each cluster is indicated.

