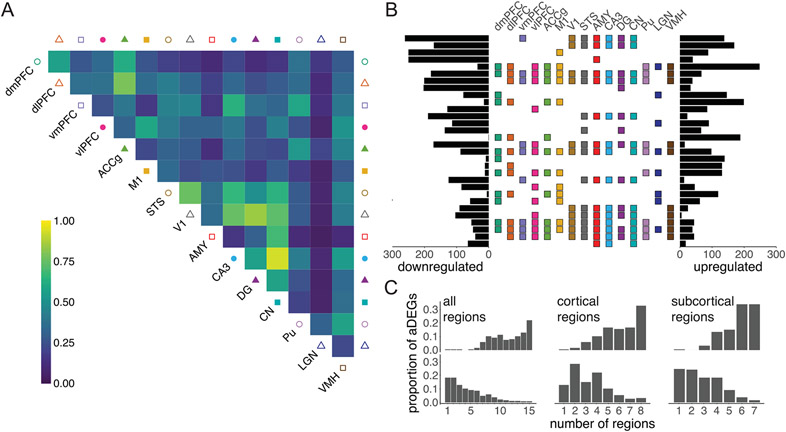
Extended Data Fig. 5 ∣. Similarities of age effects across brain regions.
(a) Proportion of aDEGs with shared magnitude between brain regions. aDEGs share magnitude between regions when they share signs and their effect estimates are within a factor of 2 from one another. These conditions for sharing are more stringent than those in Fig. 2b, which does not require the latter criterion. For each pair of regions, genes are included if they were significant (LFSR < 0.2) in either region. (b) Upset plot highlights brain region combinations with the greatest number of aDEGs with shared signs. Note that among the top region combinations are single-region-specific aDEGs as well as wbaDEGs. (c) Proportion of aDEGs that exhibit (top) shared signs or (bottom) shared magnitudes across variable numbers of brain regions. These distributions reveal that subcortical regions sampled exhibited slightly broader sharing than cortical regions. For this analysis, genes are included if they were significant (LFSR < 0.2) in any region.

