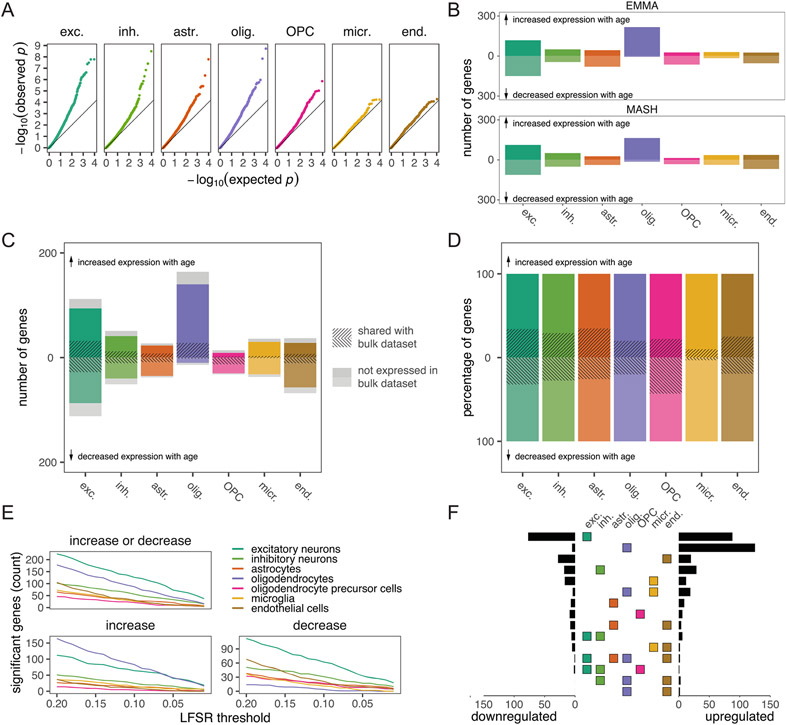
Extended Data Fig. 7 ∣. Age-associated differences in gene expression within single cell types.
(a) QQ plot of EMMA tests on pseudobulk data show a strong enrichment of low P values (all EMMA tests are two-sided). (b) Comparison of model estimates from EMMA (FDR < 0.2) and MASH (LFSR < 0.2) show similar numbers of significant genes. (c). Cell-type aDEG counts (MASH) classified according to overlap with expressed genes and aDEGs from bulk RNA-seq analysis of the dlPFC. (d). Percentages of aDEGs overlapping with aDEGs from bulk RNA-seq analysis of the dlPFC (excluding genes not expressed in both modalities). (e) Rank order of significant genes per cell type are robust across a range of significance (LFSR) thresholds. (f) Upset plot shows rank order of cell type combinations with the greatest number of genes exhibiting significant age-associated differences in expression.

