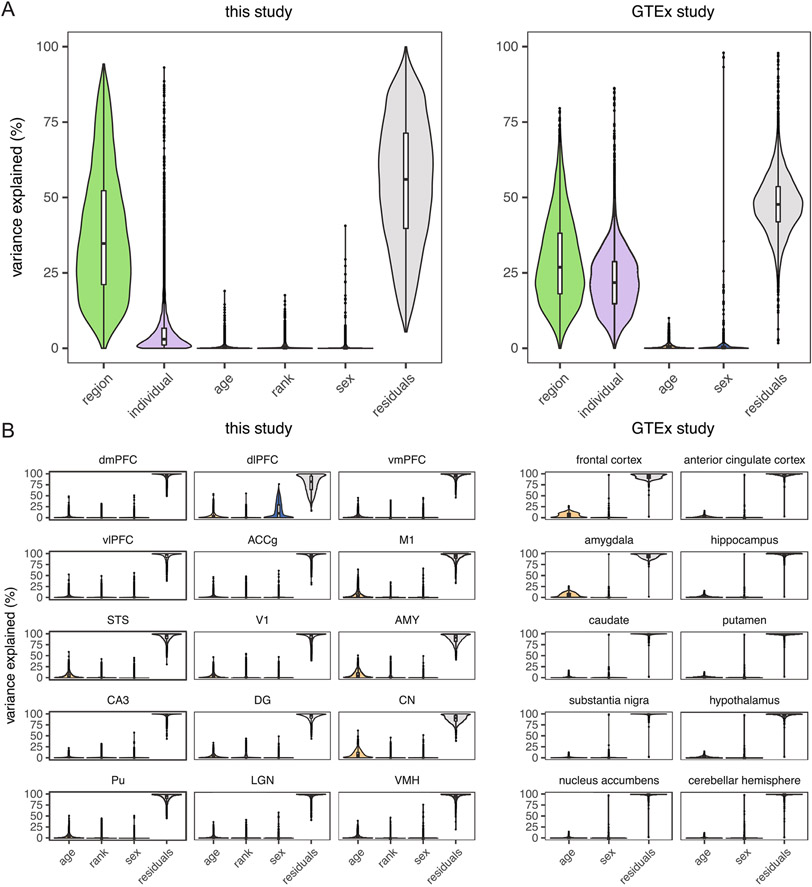
Extended Data Fig. 3 ∣. Comparison of variance partitioning of age between macaques and humans.
(a) Age explains similar proportions of variance in global gene expression across diverse brain regions between macaques from this study (left) and humans from the GTEx study (right). Median variance explained by age was 0.19% (interquartile range [IQR] = 0.04–0.51%) in this study (N = 527 biologically independent samples) and 0.26% (IQR = 0.07–0.82%) in the GTEx study (N = 2,642 biologically independent samples). Effects of technical covariates were first removed to facilitate this comparison. (b) Age explains similar proportions of variance in gene expression within individual brain regions. Median variance explained by age ranged from 0.6–6.4% across brain regions from this study (N = 36 biologically independent animals, left) and ranged from 0.3–4.2% across brain regions from the GTEx study (N = 382 biologically independent individuals, right). Box plots depict the median (center), and IQR (bounds of box), with whiskers extending to either the maxima/ minima or to the median ±1.5×IQR, whichever is nearest.

