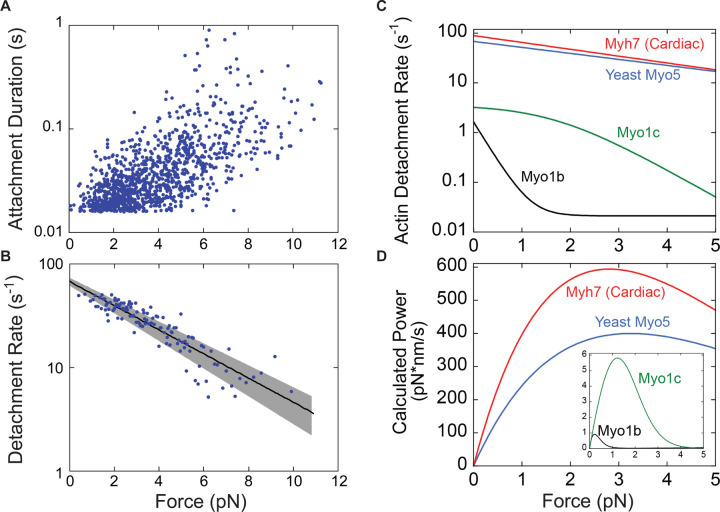
Figure 4: Myo5 attachment lifetimes are substantially less force-dependent than other known type I myosins.
An isometric optical force clamp was utilized to determine the force-sensitivity of the detachment of Myo5 from actin. (A) Durations of individual actomyosin attachments as a function of force, plotted on a semi-log scale (B) The solid black line shows the force dependence of the detachment rates determined by MLE fitting of unaveraged points in A. For illustration purposes, attachment durations from (A) were binned by force at every 10 points, averaged, and converted to rates. Best- fit parameters were determined by MLE fitting and 95% confidence intervals were calculated via bootstrapping. The solid black line is calculated from best fit parameters (, ), while the gray shaded region is the 95% confidence interval (, ). All MLE fitting was performed on unaveraged data and was corrected for instrument deadtime. (C) The force dependent detachment rate of Myo5 (from panel B) plotted alongside the force dependent detachment rates for Myo1b, Myo1c, and β-cardiac muscle myosin, Myh7. (D) Power output for the same four myosins calculated over a range of forces by multiplying the functions from (C) by the applied force F, and the step size and duty ratios of each myosin.

