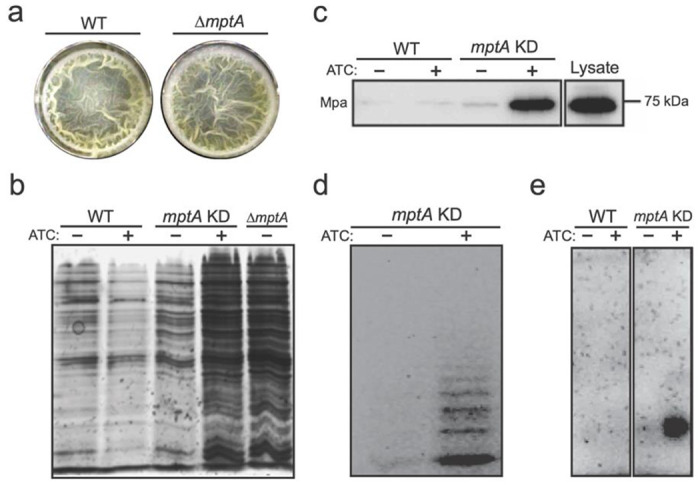
Figure 2. MptA-deficient cells lyse.

a) Top-down view of WT and ΔmptA pellicle biofilms after 5-day growth in M63 at 37°C. b) SDS-PAGE of culture filtrates from WT, mptA KD, and ΔmptA pellicles visualized by silver staining. c) Western blot of WT and mptA KD pellicle culture filtrates to visualize the cytoplasmic marker protein Mpa. Lysate was diluted to match the protein concentration of the induced mptA KD pellicle culture filtrate as measured by absorbance at 280 nm. d) Fluorophore-assisted carbohydrate electrophoresis of the mptA KD pellicle culture filtrate. e) Agarose gel electrophoresis of nucleic acids in the pellicle culture filtrate visualized by ethidium bromide staining.
