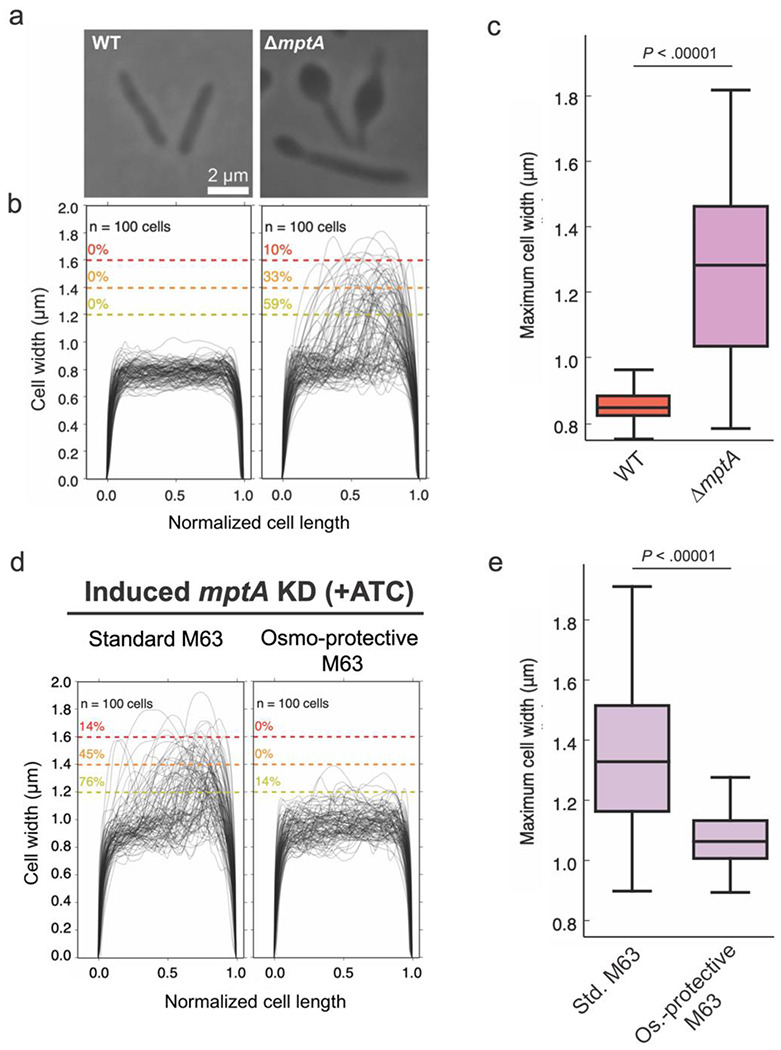
Figure 3. Defective cell morphology of ΔmptA grown as pellicle in M63 medium.

a) Example phase micrographs of WT and ΔmptA cells grown as pellicles in M63 medium. b) Cell width profiles of both strains, with each cell’s length normalized to 1 (0.5 corresponds to midcell). The percentage values above the dotted colored lines indicate the portion of cells exhibiting maximum cell widths greater than or equal to the corresponding cell width threshold. c) boxplot comparing the distribution of maximum cell widths between WT and ΔmptA strains grown as pellicle biofilms. d) Cell width profiles of mptA KD cells induced with ATC grown as pellicle biofilms in standard (non-osmoprotective) M63 and osmoprotective M63 media. e) boxplot comparing the distribution of maximum cell widths between mptA KD pellicle biofilm cells grown in standard vs. osmoprotective M63 medium.
