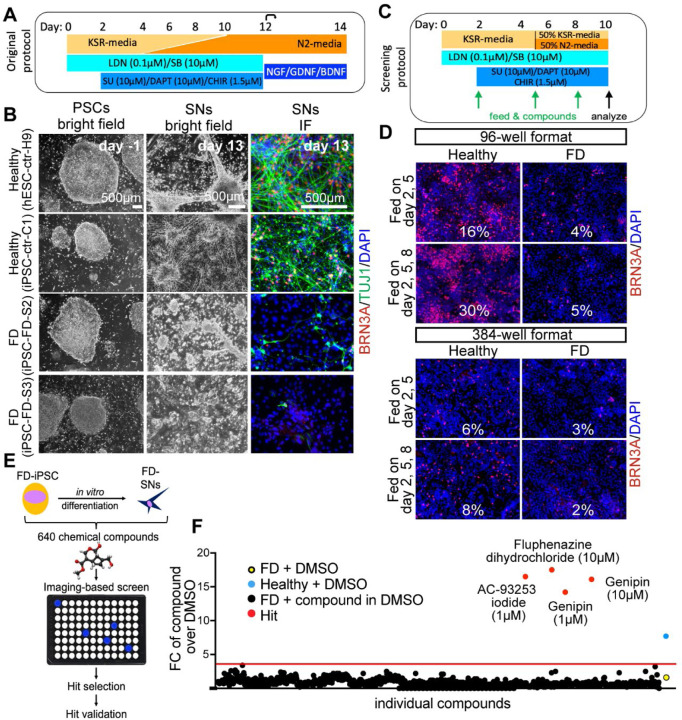
Figure 1. Chemical screen on FD sensory neurons.
A) Differentiation protocol adapted from Chambers et al., 2012. B) Bright filed imaging shows normal morphology of undifferentiated hPSCs in all lines (left column). SN differentiation is impaired in both FD lines, but normal in healthy control lines (right two columns). C) Differentiation protocol adapted to high-throughput screening conditions. D) The SN differentiation protocol is most efficient in 96 wells when the cells are fed three times. E) Cartoon of the screen set up. F) 640 compounds from the LOPAC chemical library (the first half) were screened. Controls included DMSO only wells, healthy hPSC-ctr-H9 with DMSO (blue dot = positive control), iPSC-FD-S2 iPSCs with DMSO (yellow dot=negative control). Hit compounds were called when the fold change (FC) over the average of all DMSO wells was above the average of all compounds plus 3 SDs (here 3.8, red dots). Every compound was screened at 1 mM and 10 mM. 16 images were taken for each well, all wells were imaged for the ratio of BRN3A+/DAPI+ staining.

