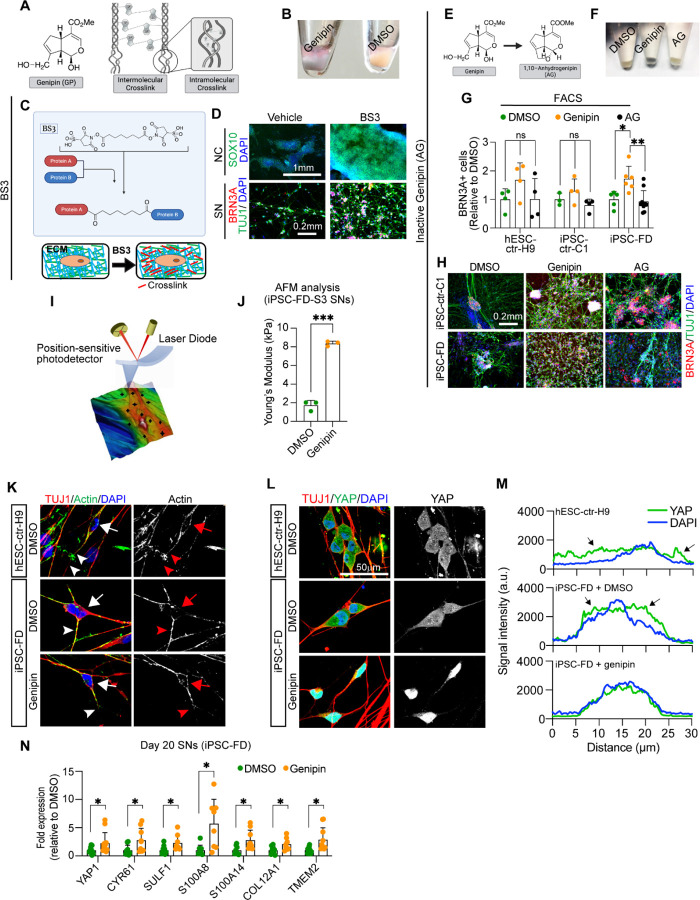
Figure 6. Genipin rescues FD phenotypes via crosslinking of extracellular matrix proteins and activates.
A) Genipin chemical structure and schematic of intermolecular and intramolecular crosslinking. B) Treatment with genipin turns cells blue. C) Schematic of BS3 crosslinking action and its extracellular location. D) BS3 rescues the NC and SN differentiation defect in FD. FD cells were differentiated in the presence of DMP and fixed on day 12 (NC) and day 20 (SN). Following staining using the indicated antibodies. n=3–5 biological replicates. E-H) 1,10-anhydrogenipin (AG) does not rescue the SN defect in FD. E) AG chemical structure. F) AG does not turn cells blue. G, H) AG does not promote FD SN differentiation. Cells were differentiated into SNs in the presence of genipin or AG. SNs were fixed on day 20 and stained for BRN3A for intracellular flow cytometry analysis (G, n=6–8 biological replicates), or stained for BRN3A, TUJ1, and DAPI for IF (H, n=6–8 biological replicates). I, J) Genipin-mediated crosslinking increases ECM stiffness. I) AFM Experiment schematics. J) Genipin increases the Young’s modulus of SNs. iPSC-FD-S3 SNs were fixed on day 25 and analyzed by AFM (n=3 biological replicates). K-M) Genipin reorganizes the actin cytoskeleton and induces transcription of YAP-dependent genes. K) Genipin partially rescues the differences of actin expression pattern in healthy and FD SNs. Day 20 SNs were fixed and stained for the indicated antibodies. Images were obtained by confocal microscopy. Actin signal in the cell body (arrows) or the axons (arrowheads) are highlighted. L, M) YAP localization changes in the presence of genipin. Day 20 SNs were fixed and stained for the indicated antibodies. M) YAP and DAPI signal intensity from images on L) was measured and plotted n=6–7 biological replicates). Arrows indicate YAP signal outside of the nucleus (stained with DAPI). N) Expression of YAP-dependent genes. RNA from FD SNs treated with DMSO or Genipin was extracted on day 20 and gene expression was analyzed by RT-qPCR (n=7–9 biological replicates). All graphs show mean ± s.d.. For G, one-way ANOVA followed by Tukey’s multiple comparisons. For J, two-tailed t test with Welch’s correction. For N, two-tailed t test. ns, non-significant, *p<0.05, **p<0.005, ***p<0.001. In G, M, and L data from iPSC-FD-S2 and iPSC-FD-S3 are pooled as FD.

