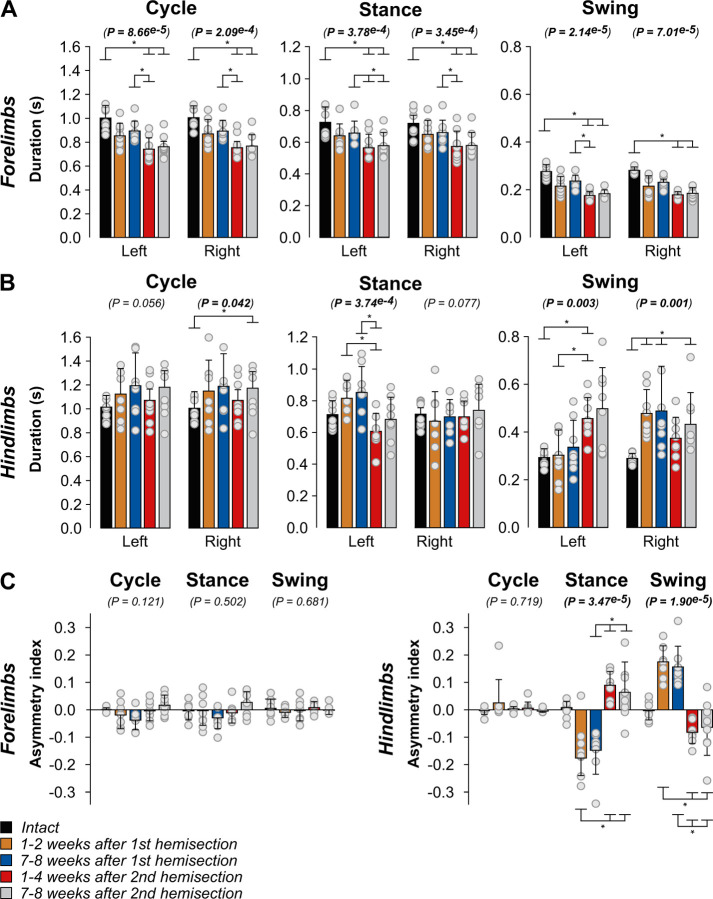
Figure 5. Temporal adjustments during quadrupedal treadmill locomotion before and after staggered hemisections for the group.
A and B) Cycle, stance and swing durations for the fore- and hindlimbs, respectively. C) Asymmetry indexes of temporal variables. We averaged 8–36 cycles per cat. The bars represent mean ± SD for the group (n = 8 cats) while grey circles represent individual data points (mean for each cat). The P values show the main effect of state (one-factor Friedman test). Asterisks indicate significant differences between time points from the Wilcoxon signed-rank test with Bonferroni’s correction.

