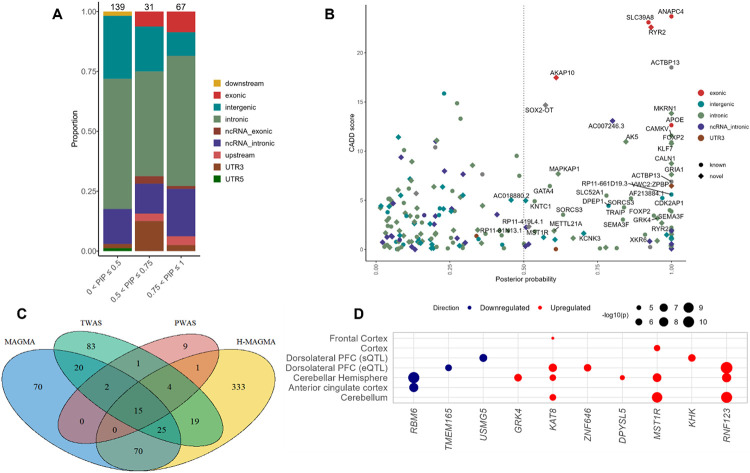
Figure 3. Gene prioritization for pain intensity.
A, Genomic annotation of credible sets using FINEMAP shows enrichment largely in non-coding regions and to a lesser extent in exons. B, Annotation of known and novel credible genes. Dashed lines indicate posterior probability > 0.5. C, Number of overlapping genes across functional prediction models. D, Tissue enrichment of prioritized genes using SMR and GTEx data show enrichment in brain regions. Size of circle reflects −log10P. Bonferroni correction was applied within each tissue conditioned on the number of genes tested.

