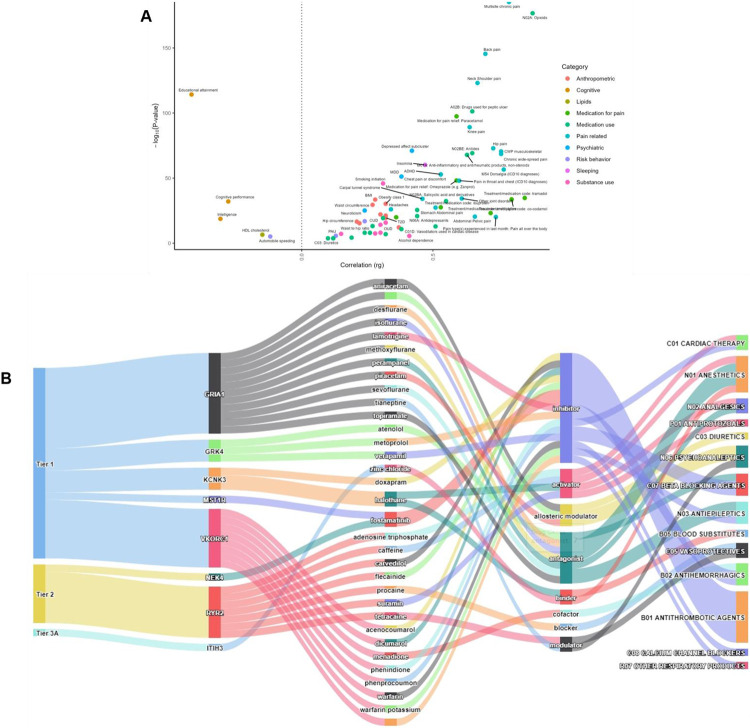
Figure 4. Genetic correlation and drug repurposing.
A, Genetic correlation for pain intensity using LDSC. All points passing Bonferroni correction (Bonferroni correction threshold = 5.62 × 10⁻⁴ [0.05/89]) are plotted. The color of the circle indicates the phenotypic category. B, Druggable targets and drug interactions for 8 credible genes associated with pain intensity. For a full list of credible drug targets see Supplementary Table 30.

