
Figure 1.
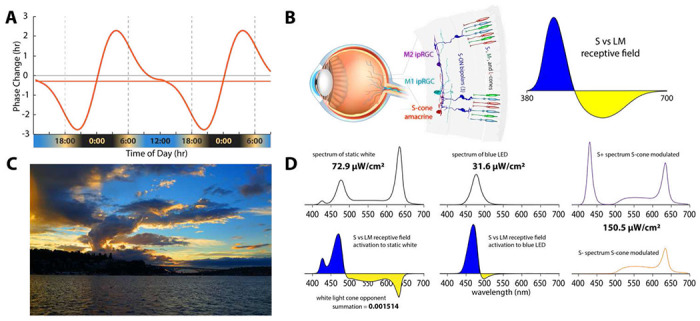
A. Phase response curve based on Khalsa (2003)5 that is aligned with earth time so that the beginning of the internal biological night occurs at sunset and the end of the internal biological night occurs before wake time just after sunrise as indicated below the x-axis of the curve. B. (left) Illustration of the color vision circuitry for S-ON and S-OFF types of primate ipRGCs. (right) Illustration of the spectrally opponent response of an S-ON ipRGC with S - (L+M) cone inputs. C. Image of sunset in Seattle Washington illustrating how contrasting short and long wavelength light near the horizon produce a stimulus capable of driving spectrally opponent inputs to ipRGCs making them act as sunrise/sunset detectors. D. Spectral distributions of experimental light stimuli and their predicted effects on the color opponent inputs to ipRGCs. (Top left) Spectrum of the experimental white light with chromaticity coordinates 0.333, 0.333. (Top middle) Spectrum of the LED-derived experimental “blue” light with a spectral peak at 476 nm. (Bottom; left and middle) the product of wavelength-by-wavelength multiplication of the spectral distribution of the white light (Bottom left) times the spectrally opponent response of an ipRGC. Integration of the curve in across wavelength yields the predicted very small relative response of the ipRGC to the white light. (Bottom middle) The product of multiplication of the spectral distribution of the blue light times the spectrally opponent response of an ipRGC. Integration across wavelengths yields the predicted large relative response of the ipRGC to the blue light. (Right) The two spectra which are alternate to produce the S-cone modulating light.