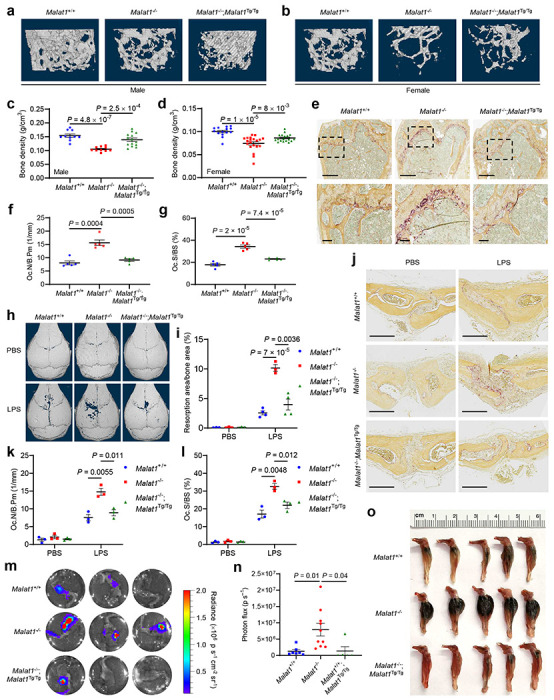
Figure 2. Targeted inactivation and restoration of Malat1 reveal that Malat1 protects against osteoporosis and bone metastasis.

a, b. Representative μCT images of 3D bone structures of the femurs from 6-month-old male (a) and female (b) Malat1+/+, Malat1−/−, and Malat1−/−;Malat1Tg/Tg mice.
c, d. μCT-based measurements of the bone mineral density of the femurs from 6-month-old male (c; n = 5-7 mice per group) and female (d; n = 7-10 mice per group) Malat1+/+, Malat1−/−, and Malat1−/−;Malat1Tg/Tg mice, with left and right femurs for each mouse measured.
e. Representative TRAP staining images of the femurs from 6-month-old male Malat1+/+, Malat1−/−, and Malat1−/−;Malat1Tg/Tg mice. Scale bars, 700 μm in upper panels and 100 μm in lower panels.
f, g. Quantification of osteoclast numbers per bone perimeter (Oc.N/B.Pm, f) and osteoclast surface per bone surface (Oc.S/BS, g) in femurs of the mice described in e. n = 5 mice per group.
h-l. μCT images of the surface of calvariae (h), quantification of the relative resorption area (i), TRAP staining images of calvarial sections (j), the number of osteoclasts per bone perimeter (Oc.N/B.Pm, k), and osteoclast surface per bone surface (Oc.S/BS, l) in the calvarial bones from 8-week-old female Malat1+/+, Malat1−/−, and Malat1−/−;Malat1Tg/Tg mice after the administration of PBS or LPS to the calvarial periosteum for 5 days, n = 3-4 mice per group. Scale bars in j, 200 μm.
m-o. Bioluminescent imaging (m), quantification of photon flux (n), and photos (o) of the tibiae of 6-month-old Malat1+/+, Malat1−/−, and Malat1−/−;Malat1Tg/Tg mice at day 26 after intratibial injection of 5,000 B16F1 melanoma cells.
Statistical significance in c, d, f, g, i, k, l, and n was determined by a two-tailed unpaired t-test. Error bars are s.e.m.
