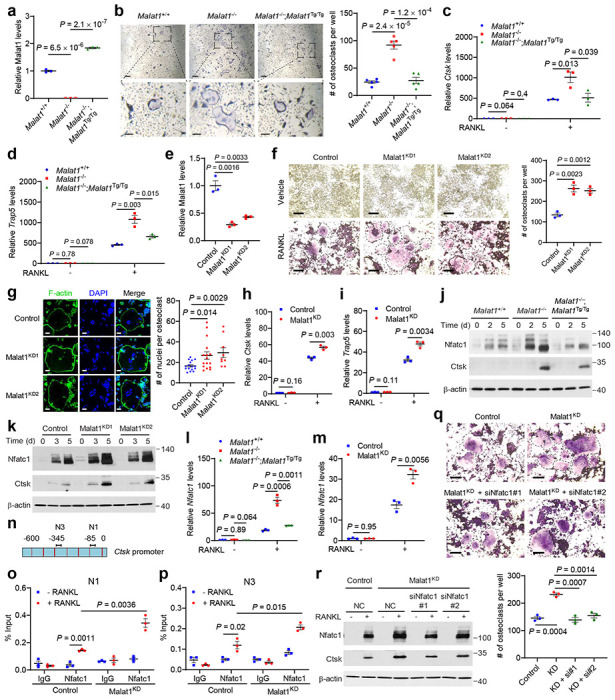
Figure 3. Malat1 deficiency promotes osteoclastogenesis through the activation of Nfatc1.

a. qPCR of Malat1 in primary BMMs isolated from Malat1+/+, Malat1−/−, and Malat1−/−;Malat1Tg/Tg mice.
b. TRAP staining images (left panel) and quantification (right panel) of Malat1+/+, Malat1−/−, and Malat1−/−;Malat1Tg/Tg BMMs treated with M-CSF (50 ng/mL) and RANKL (100 ng/mL) for 4 days. Multinucleated TRAP-positive cells were counted. Scale bars, 125 μm in upper panels and 50 μm in lower panels.
c, d. qPCR of Ctsk (c) and Trap5 (d) in the BMMs described in b.
e. qPCR of Malat1 in control and Malat1-knockdown RAW264.7 cells generated by CRISPR interference.
f. TRAP staining images (left panel) and quantification (right panel) of control and Malat1-knockdown RAW264.7 cells treated with RANKL (50 ng/mL) for 4 days. Multinucleated TRAP-positive cells (outlined by dashed lines) were counted. Scale bars, 100 μm.
g. Left panel: after stimulation with RANKL (50 ng/mL) for 4 days, control and Malat1-knockdown RAW264.7 cells were stained with Phalloidin Green 488 (indicating F-actin rings) and DAPI (blue; indicating nuclei). Right panel: quantification of the number of nuclei per osteoclast. Scale bar, 50 μm.
h, i. qPCR of Ctsk (h) and Trap5 (i) in control and Malat1-knockdown RAW264.7 cells treated with RANKL (50 ng/mL) for 3 days.
j, k. Immunoblotting of Nfatc1, Ctsk, and β-actin in Malat1+/+, Malat1−/−, and Malat1−/−;Malat1Tg/Tg BMMs treated with M-CSF (50 ng/mL) and RANKL (100 ng/mL) for 2 days and 5 days (j), and in control and Malat1-knockdown RAW264.7 cells cultured with RANKL (50 ng/mL) for 3 and 5 days (k).
l, m. qPCR of Nfatc1 in Malat1+/+, Malat1−/−, and Malat1−/−;Malat1Tg/Tg BMMs treated with M-CSF (50 ng/mL) and RANKL (100 ng/mL) for 4 days (l), and in control and Malat1-knockdown RAW264.7 cells treated with RANKL (50 ng/mL) for 3 days (m).
n. Graphical representation of the mouse Ctsk promoter. Primers previously reported for amplifying N1 and N3 regions were used for ChIP-qPCR.
o, p. ChIP-qPCR analysis showing the occupancy of the N1 (o) and N3 (p) regions of the Ctsk gene promoter by Nfatc1 immunoprecipitated from control or Malat1-knockdown RAW264.7 cells treated with RANKL (50 ng/mL) for 3 days.
q, r. Control and Malat1-knockdown RAW264.7 cells were transfected with Nfatc1 siRNA or scrambled negative control (NC). At 24 hours after siRNA transfection, the cells were treated with RANKL for 5 days, followed by TRAP staining and quantification (q) of multinucleated TRAP-positive cells (outlined by dashed lines). Scale bars, 100 μm. Cell lysates were subjected to immunoblotting of Nfatc1, Ctsk, and β-actin (r).
Statistical significance in a-i, l, m, and o-q was determined by a two-tailed unpaired t-test. Error bars are s.e.m.
