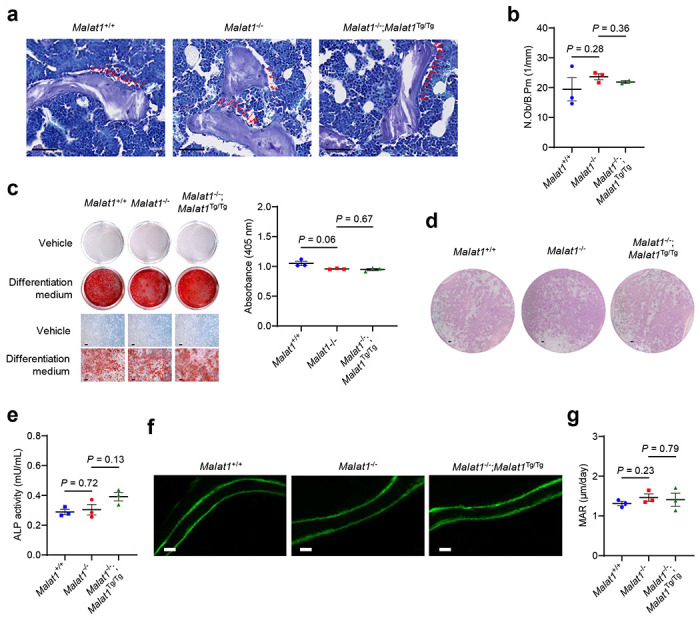
Extended Data Figure 3. Malat1 is not involved in osteoblastic bone formation.

a. Toluidine blue staining of sections of the femurs from 2-month-old male Malat1+/+, Malat1−/− and Malat1−/−;Malat1Tg/Tg mice. Scale bars, 50 μm. Red arrows indicate osteoblasts.
b. Quantification of the osteoblast numbers per bone perimeter (N.Ob/B.Pm) in the mice described in a.
c. Mesenchymal stem cells (MSCs) were isolated from Malat1+/+, Malat1−/−, and Malat1−/−;Malat1Tg/Tg mice, cultured in osteogenic differentiation medium for 14 days, and subjected to alizarin red S (ARS) staining (left panel). Scale bars, 100 μm. ARS stains were dissolved and quantitated as absorbance at 405 nm (right panel).
d. Mesenchymal stem cells (MSCs) were isolated from Malat1+/+, Malat1−/−, and Malat1−/−;Malat1Tg/Tg mice, cultured in differentiation medium for 14 days, and subjected to alkaline phosphatase (ALP) staining. Scale bars, 1 mm.
e. Activity of secreted ALP was measured in the culture medium collected after the MSC differentiation described in d.
f. Representative images of bone formation rates of 2-month-old male Malat1+/+, Malat1−/−, and Malat1−/−;Malat1Tg/Tg mice, as determined by sequential labeling with calcein. Scale bars, 10 μm.
g. Bone histomorphometric analysis of mineral apposition rate (MAR) in the femurs of 2-month-old male Malat1+/+, Malat1−/−, and Malat1−/−;Malat1Tg/Tg mice. n = 3 mice per group.
Statistical significance in b, c, e, and g was determined by a two-tailed unpaired t-test. Error bars are s.e.m.
