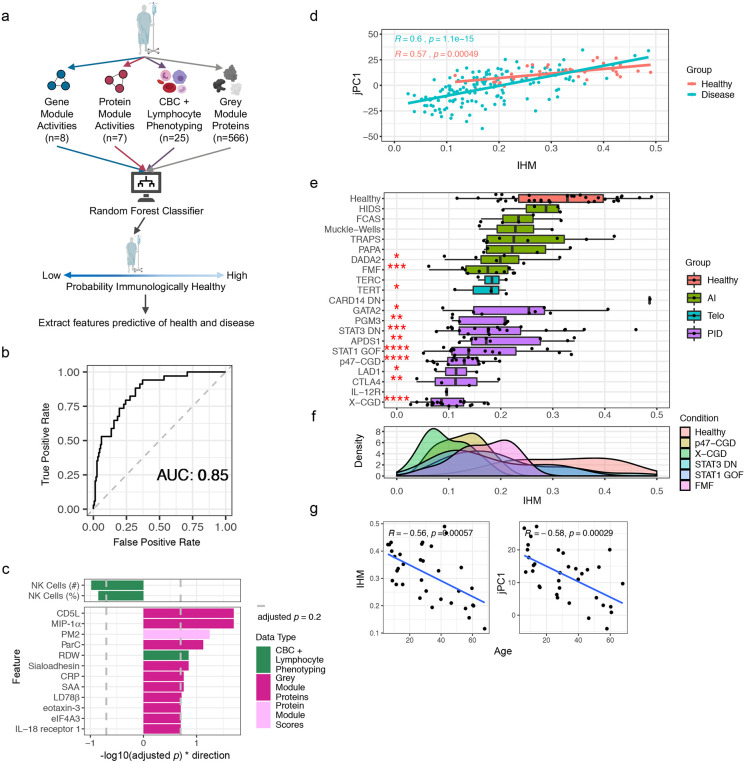
Figure 4. Top-down supervised machine learning classification analysis independently reveals an immune health metric highly concordant with that from unsupervised analysis.
a, Conceptual overview of the supervised machine learning analysis of healthy vs. disease patients using Random Forest classifiers to obtain a probability score of immunological health [the Immune Health Metric (IHM)]. The number of temporally stable features used from each data modality is shown. Models were trained using the subject-level data (n = 182 subjects with serum protein, whole blood transcriptomic, and CBC/TBNK data).
b, Receiver Operating Characteristic (ROC) curve for distinguishing healthy subjects vs. patients using the approach shown in (a).
c, Barplot of the −log10 adjusted p values for features passing a 0.2 FDR significance cutoff (grey dashed line; p values estimated through permutation testing of Global Variable Importance from the Random Forest classifiers); these are top features contributed to the classifier used to derive the IHM. Direction was determined as the sign of the average difference between heathy subjects and patients from all disease groups.
d, Scatterplot showing correlation between IHM score and the jPC1 scores across subjects. Least squares regression lines included for healthy subjects with correlation statistics shown. 95% confidence interval of the estimated conditional mean is shown. N = 148 and 34 disease patients and healthy subjects, respectively.
e, Boxplots of IHM scores of individual subjects grouped by condition (disease and healthy groups). The healthy group (top row) is shown in red; the statistical significance of the comparison between the condition and the healthy groups is shown for conditions that tested significant (*p < 0.05, **p < 0.01, ***p < 0.001, p values from two-sided Wilcoxon test). Box plot center lines correspond to the median value; lower and upper hinges correspond to the first and third quartiles (the 25th and 75th percentiles), and lower and upper whiskers extend from the box to the smallest or largest value correspondingly, but no further than 1.5X inter-quantile range. AI = autoinflammatory diseases. Telo = telomere disorders. PID = primary immunodeficiencies.
f, Similar to (e), but here showing smoothed density of IHM scores for each of the groups with at least 10 subjects.
g, Scatterplots with trendlines showing the age dependence of the IHM and jPC1 in healthy individuals only (Spearman correlation and p values shown; n = 34 healthy subjects with serum protein, whole blood transcriptomic, and CBC/TBNK data).

