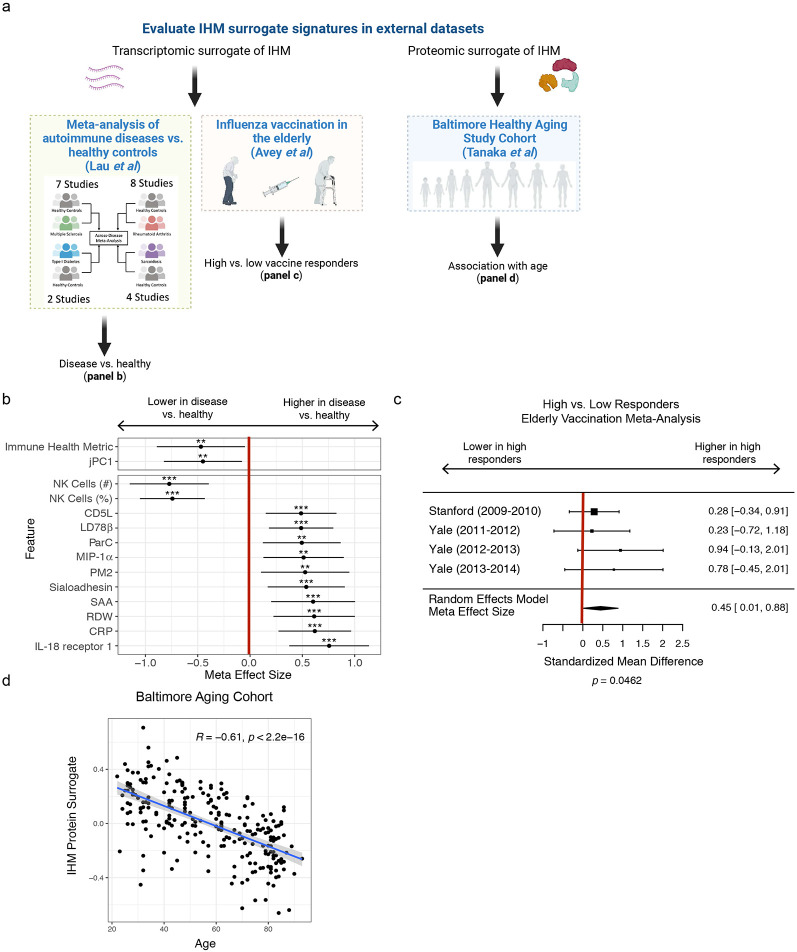
Figure 5. Assessing the IHM in independent datasets.
a, Graphical depiction of the creation of blood transcriptional and protein surrogate signatures followed by (from left to right): 1) meta-analysis of four common, non-monogenic autoimmune/inflammatory diseases across 21 independent studies, 2) meta-analysis comparing high vs. low responders in influenza vaccination in the elderly, and 3) validation of the IHM and healthy aging association using an independent cohort.
b, Plot of meta effect sizes (average difference between disease and healthy groups) for each surrogate gene signature tested using the meta-analysis, including the IHM itself with a statistically significant negative effect size (i.e., it is lower in disease than healthy). The point shows the estimated effect across all studies used in the meta-analysis and error bars show the 95% confidence interval (1.96 * standard error) in the meta-analysis.
c, Forest plot of effect sizes from the meta-analysis across four independent influenza vaccination cohorts of elderly subjects testing whether the IHM transcriptional surrogate signature evaluated at baseline before vaccination was associated with antibody titer responses to seasonal influenza vaccination in elderly individuals (i.e., whether those with better immune health according to the IHM had higher antibody responses.) Effect sizes in each study (squares), their 95% confidence interval (1.96 * standard error, error bars around square), the overall meta effect size (diamond) combining evidence across the four cohorts and the standard error of the meta-effect (width of diamond) are shown. Size of square denotes the relative number of subjects in that study.
d, Scatterplot with trendline showing the negative correlation between chronological age and the circulating protein-based IHM surrogate signature scores (see Methods – the circulating protein IHM surrogate was developed using data from our cohorts only) in healthy subjects from the independent Baltimore Aging Study (Tanaka et al., 2018). N = 240 subjects.

