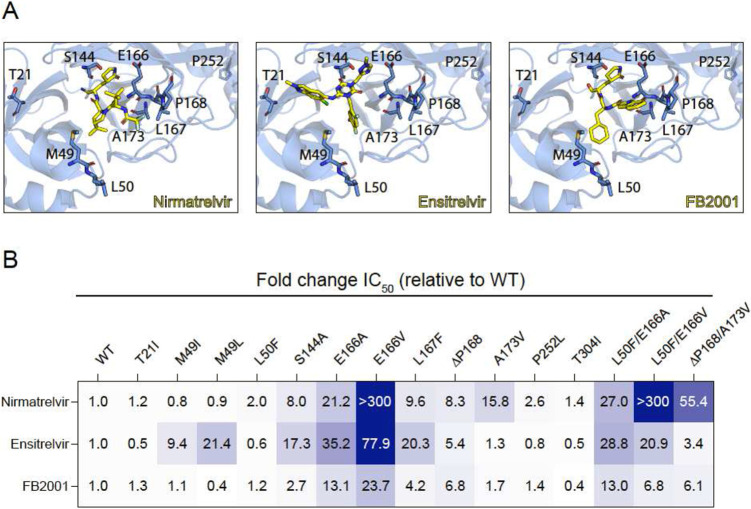
Figure 1. Resistance profiles of nirmatrelvir, ensitrelvir, and FB2001.
(A) Co-crystal structures of SARS-CoV-2 Mpro in complex with nirmatrelvir (PDB:7SI9), ensitrelvir (PDB:7VU6), or FB2001 (PDB:6LZE). Labeled residues are interrogated in panel B.
(B) Fold-change in IC50 relative to WT for the indicated mutants using the live cell gain-of-signal assay in 293T cells.

