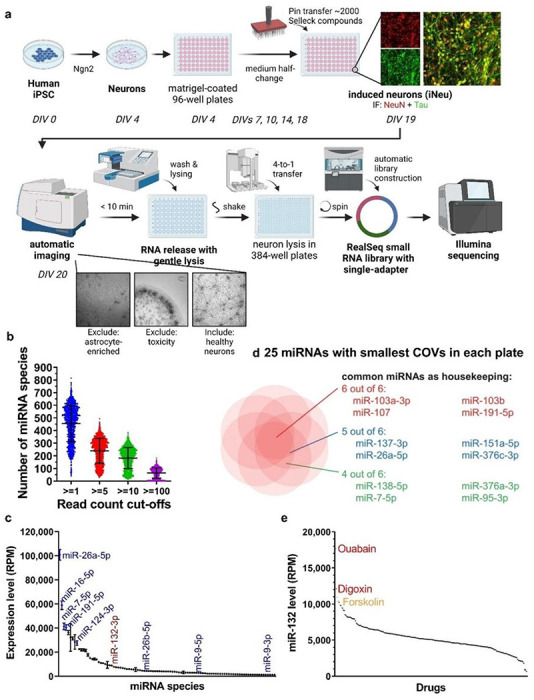
Figure 1. Experimental workflow and overview of screen results.

a, NGN2-iN generation, compound treatment, and miRNA-seq workflow (N=1 per compound). b, Average number of miRNA species detected per sample by miRNA-seq at various count cut-offs. c, Expression levels of the 100 most abundant miRNAs in vehicle-treated samples. miR-26a-5p was the most abundant miRNA detected, miR-132-3p was the 26th. d, Shared miRNAs with the lowest coefficient of variation in the plates tested. e, Waterfall plot for miR-132 expression in plate 2. Samples treated with ouabain, digoxin, and the positive control forskolin showed the highest level of miR-132.
