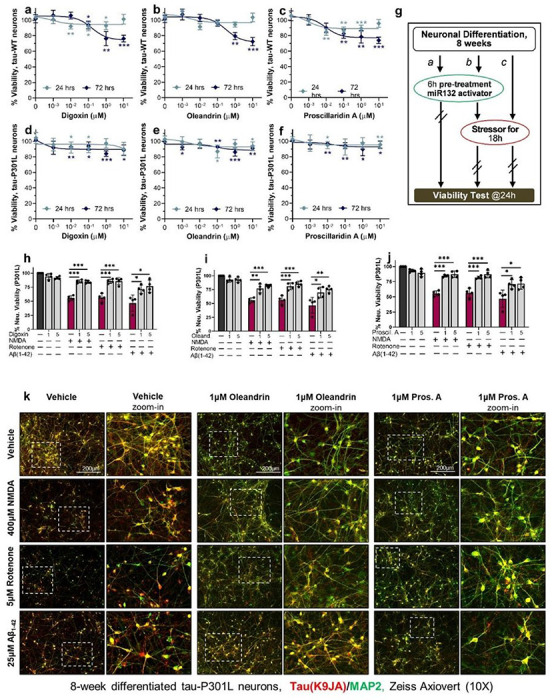
Figure 6. Cardiac glycosides protect human Tau-P301L neurons from diverse toxic insults.

a-f, Compounds concentration effect on neuronal viability after 24h or 72h treatment of WT (a-c) and Tau-P301L (d-f) human neurons. Data points indicate mean ±SD (N=2); unpaired two-tailed Student’s t-test. g, Schematic of the assay used to measure neuroprotective effects by cardiac glycosides in tauopathy neurons. h-j, Cardiac glycosides rescued the loss of viability in P301L neurons due to NMDA, rotenone, or Aβ42 oligomer treatment. Graph bars and data points show mean values ±SEM (N=2); unpaired two-tailed Student’s t-test. k, Representative images for P301L neurons at 8 weeks of differentiation treated with cardiac glycosides and each stressor compound. Total Tau (K9JA antibody) staining is shown in red, and MAP2 is shown in green. Scale bars are 200 μm.
