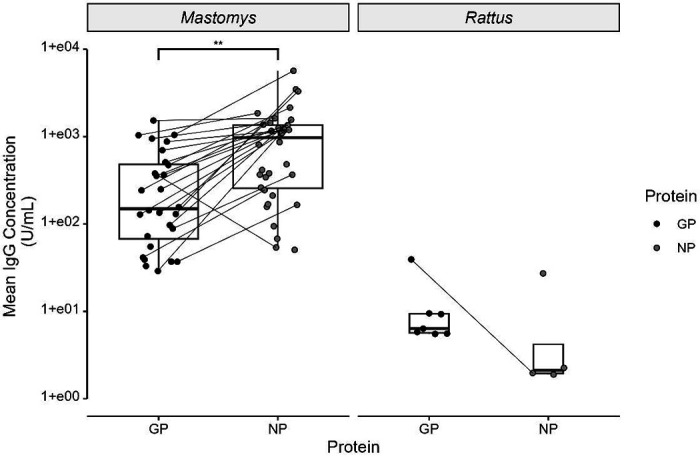
Figure 2:

Distribution of positive GP IgG and NP IgG concentrations, grouped by genus. Specimens testing positive for both GP IgG and NP IgG are shown as connected pairs. Comparison of means performed by unpaired two-tailed Student’s t-test, ** = p < 0.01 (Mastomys sp.), p = 0.69 (Rattus sp.).
