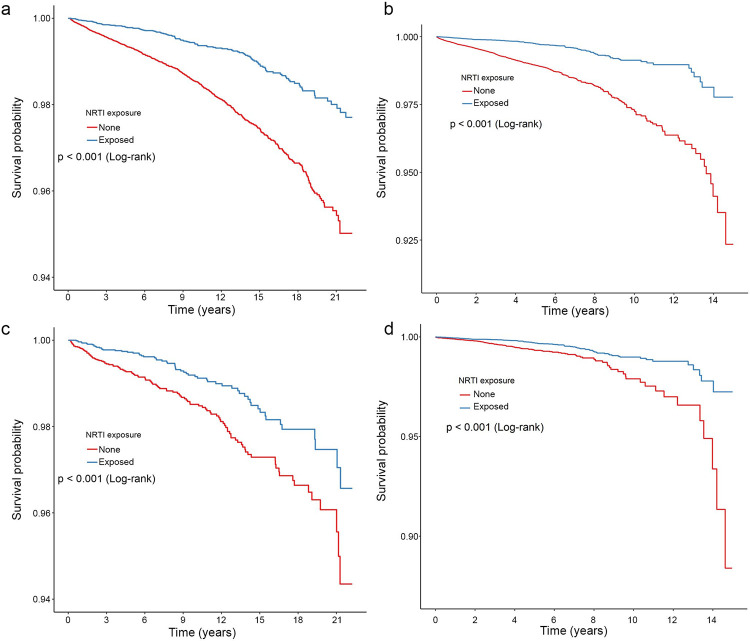
Figure 1.
Lower hazard of AD among NRTI users in the VA and Marketscan populations.
a–d, Survival curves are presented for the VA (a, c) and Marketscan (b, d) database populations, calculated for each level of nucleoside reverse transcriptase inhibitor (NRTI) exposure in the original (a, b) and propensity-score matched (c, d) populations. Log-rank P values displayed.

