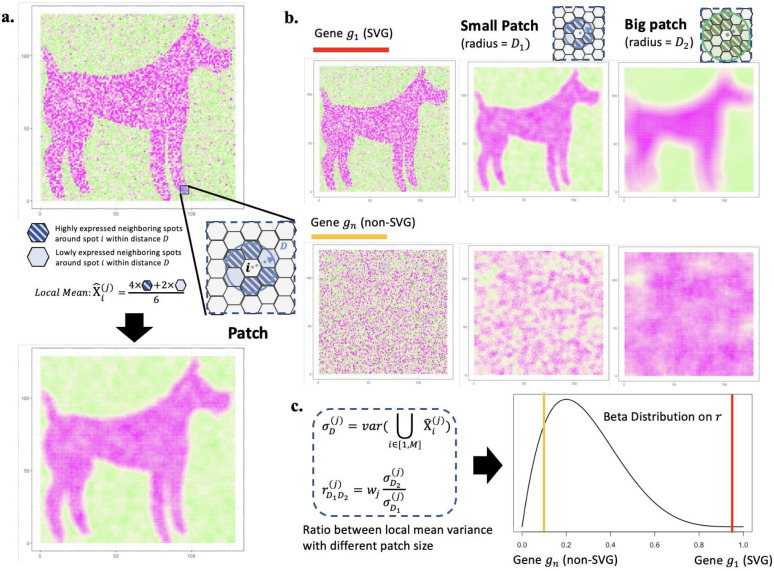
Figure 1. Scheme of BSP.
a) Definition of the patch in BSP. For spot , a patch is defined as the set of all its neighboring spots within distance . Local Mean is defined as the average expression of gene for all spots within the patch. b) Identification of SVGs with BSP. Gene indicates an SVG (red), while is a representative non-SVG gene (orange). Besides the original pattern as the left, we define a small patch of spots with a smaller radius (blue) in the middle column, and a big batch of spots with a larger radius (green) in the right column. c) The ratio of the variance of the local mean between big batch and the paired small batch is chosen as the statistical value . Gene (red bar) is statistically significant compared with the background gene (orange bar) on the fitted beta distribution of .

