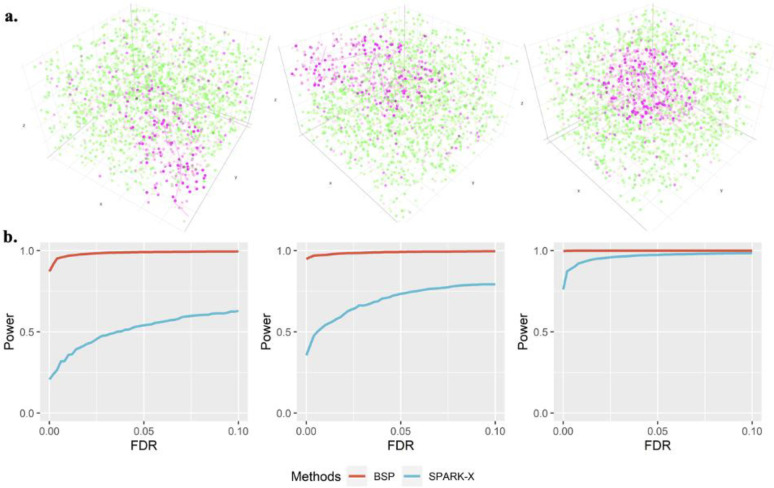
Figure 4: Power analysis for 3d simulation.
a) Spatial patterns I-III are controlled by the direction of random walks. Left: Pattern I (curved stick): the movements of random walk are monotonic in two directions (x- and z- coordinates, or y- and z-coordinates). Middle: Pattern II (thin plate): the movements of the random walk are monotonic in one direction (z-coordinates). Right: Pattern III (irregular lump): the movements of the random walk are non-monotonic in any direction. b) Power comparison of the different methods under varied pattern sizes. Power charts show the averaged true positive rates (y-axis) across 10 replicates against the false discovery rates (x-axis) for the detected SVGs using each method. Simulations were performed using fixed moderate pattern sizes (r = 2.0), moderate signal strength (FC = 2.5), moderate noise level (σ = 1), and three spatial expression patterns I-III (left to right). All simulations were generated based on the seqFISH data with 10 segments (z-coordinate) and 225 spots of cells on each piece (x- and y-coordinates). Each simulation replicate contains 1,000 SVGs and 9,000 non-SVGs.

