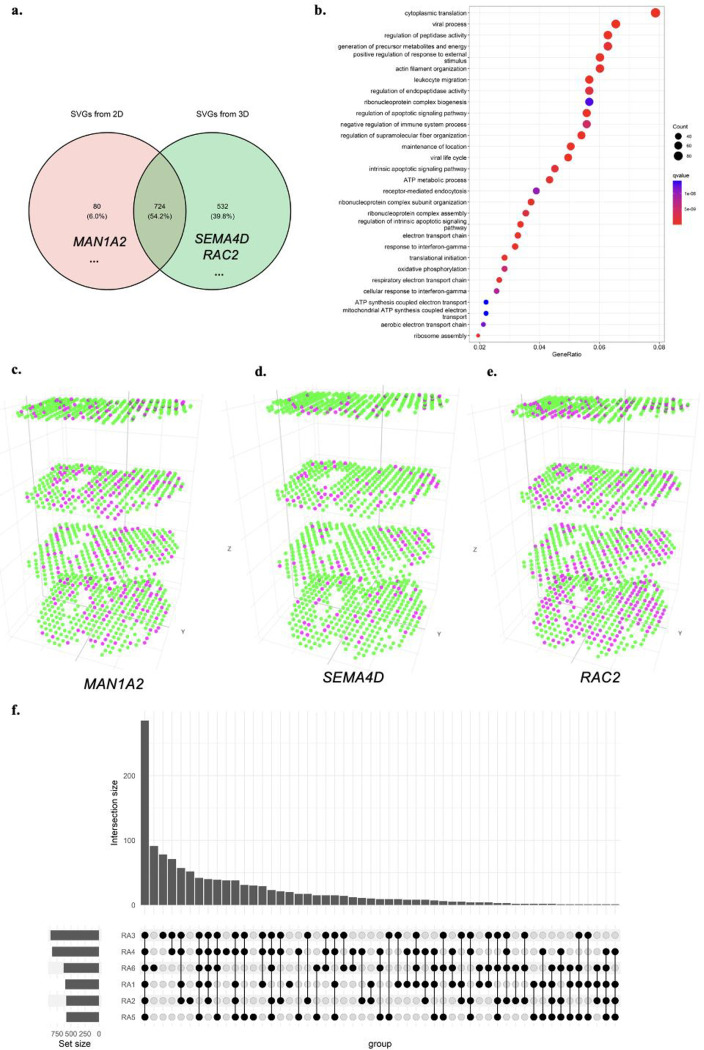
Figure. 5.
BSP identifies much more meaningful SVGs in the 3D study than stacking results on 2D analysis. a) Venn diagram of SVGs identified by 2D meta-analysis and 3D analysis; b) Gene ontology analysis on SVGs identified in patient RA1 in 3D setting; c) MAN1A2 gene, significant in 2D analysis but not an SVG in 3D setting; d) SEMA4D gene identified as SVGs in 3D transcriptomics but missed by 2D analysis; e) RAC2 gene, a very significant SVGs in 3D transcriptomics but missed by 2D analysis; f) Upset plot of enriched gene ontology terms on all six individual RA patients.

