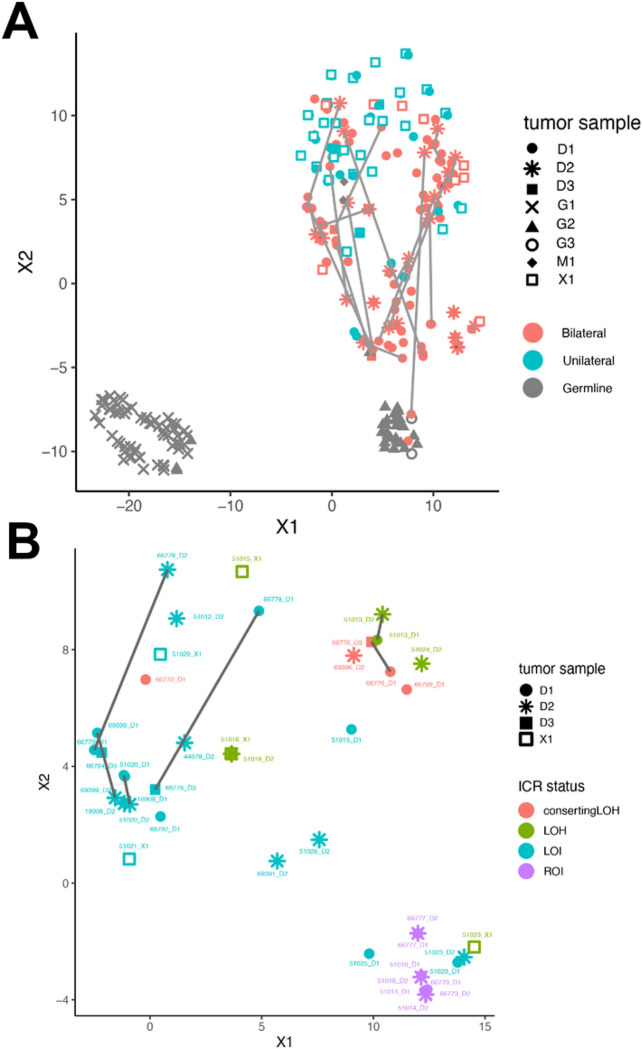
Figure 7. TSNE clustering analysis of 850K EPIC Methylation Beadchip array.
(A) Predominant clusters of unilateral (teal) and bilateral (salmon) WT. BWT cluster closer to adjacent non-diseased kidney (gray triangles) than unilateral WT. Gray lines connect synchronous BWT. However, large differences in synchronous BWT correlated with differential tumor purity in each DNA sample. (B) Clustering of BWT with a tumor purity filter applied (excluding specimens with tumor purity < 80%) shows near adjacent clustering of paired synchronous BWT specimens. Within BWT, samples cluster according to 11p15.5 status: 11p15.5 LOI (light blue), 11p15.5 LOH (red and green), and 11p15.5 ROI (purple). The greatest difference between paired synchronous BWT samples is seen in samples with 11p15.5 LOI (samples connected by dashed lines).

