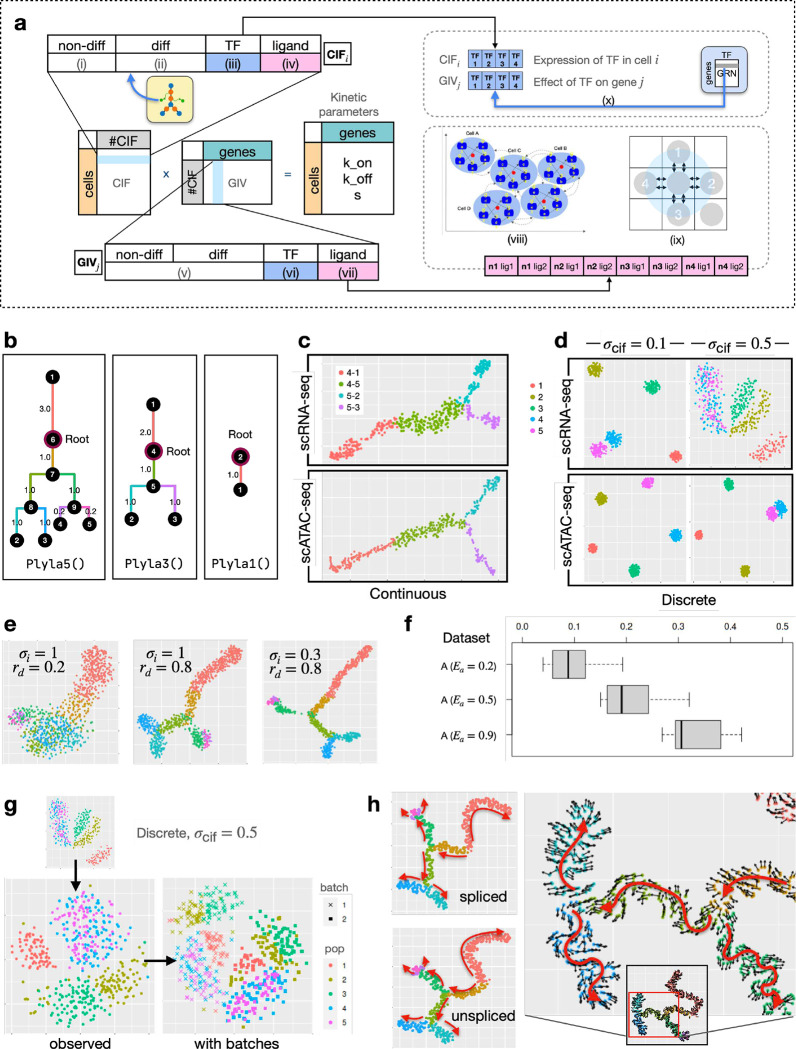
Figure 2. scMultiSim generates multi-modal single cell data from pre-defined cell clustering structure or trajectories.
(a) The CIF and GIV matrix. We multiply the CIF and GIV matrix to get the cell×gene matrix for each kinetic parameter. CIFs and GIVs are divided into segments to encode different biological effects, where each segment encodes a certain type of biological factor. A cellular heterogeneity is modeled in the CIF, and regulation effects are encoded in the corresponding GIV vector. (viii) is the illustration of the cell-cell interactions and in-cell GRN in our model. (ix) is the grid system representing spatial locations of cells. A cell can have at most four neighbors (labeled 1–4) within a certain range (blue circle). The cell at the bottom right corner is not a neighbor of the center cell. (b) Three trees are provided by scMultiSim and used to produce the datasets. Phyla1 is a linear trejectory, while Phyla3 and Phyla5 has 3 and 5 leaves, respectively. (c) t-SNE visualization of the paired scRNA-seq and scATAC-seq data (without adding technical noise) from the main dataset MT3a (continuous populations following tree Phyla3), both having ncell = ngene = 500. (d) t-SNE visualization of the paired scRNA-seq and scATAC-seq data (without adding technical noise) from the main datasets MD3a and MD9a (discrete populations with five clusters, following tree Phyla5). (e) Additional results showing the effect of σi and rd using datasets A. (f) Additional results exploring the ATAC effect parameter Ea using datasets A. Averaged Spearman correlation between scATAC-seq and scRNA-seq data for genes affected by one chromatin region, from 144 datasets using various parameters (σi, σcif, rd, continuous/discrete). (g) The observed RNA counts in dataset MD9a with added technical noise and batch effects. (h) The spliced true counts, unspliced true counts, and the RNA velocity ground truth from dataset V. The velocity vectors point to the directions of differentiation indicated by red arrows, from the tree root to leaves.

