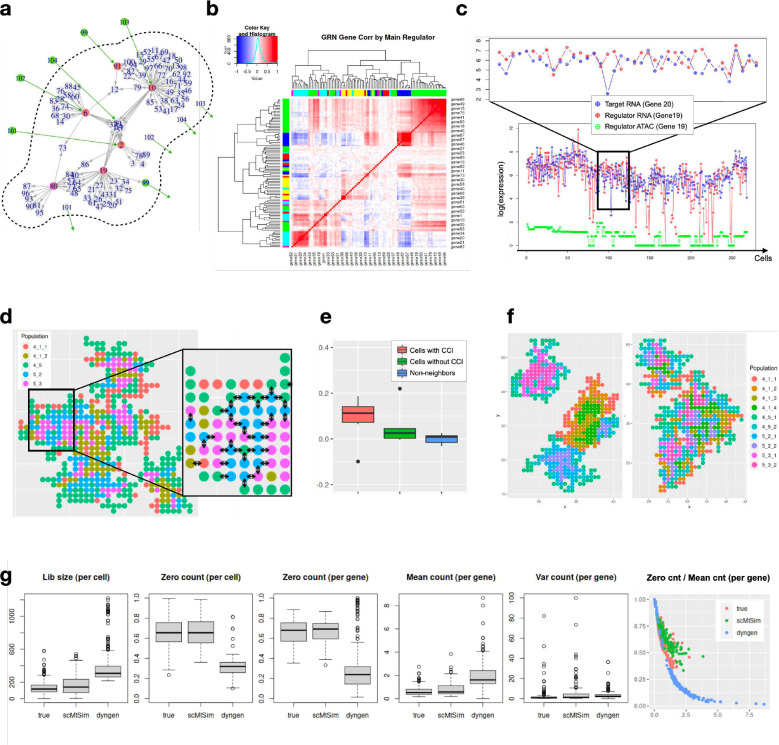
Figure 3. scMultiSim generates realistic single cell gene expression data driven by GRN and cell-cell interaction.
(a) The GRN and CCIs used to generate the main datasets. Red nodes are TF genes and green nodes are ligand genes. Green edges are the added ligand-receptor pairs when simulating cell-cell interactions. (b-e) Results from dataset MT3a, which uses Phyla3, 500 genes, 500 cells and σcif =0.1. (b) The gene module correlation heatmap. The color at left or top represents the regulating TF of the gene. Genes regulated by the same TF have higher correlations and tend to be grouped together. (c) The log-transformed expression of a specific TF-target gene pair (gene19-gene20) for all cells on one lineage (4–5-3 in Phyla3). Correlation between the TF and target expressions can be observed. We also show the chromatin accessibility level for the TF gene 19, averaged from the two corresponding chromatin regions of the gene. Significant lower expression of gene 19 can be observed when the chromatin is closed. (d) The spatial location of cells, where each color represents a cell type. Arrows between two cells indicates that CCI exists between them for a specific ligand-receptor pair (gene101-gene2). By default, most cell-cell interactions occur between different cell types. (e) Gene expression correlation between (1) neighboring cells with CCI, (2) neighboring cells with CCI, and (3) non-neighbor cells. Cells with CCI have higher correlations. (f) scMultiSim provides options to control the the cell layout. We show the results of 1200 cells using same-type probability pn =1.0 and 0.8, respectively. When pn =1.0, same-type cells tend to cluster together, while pn =0.8 introduces more randomness. (g) Comparison between a real dataset and simulated data using multiple statistical measurements. Parameters were adjusted to match the real distribution as close as possible.

