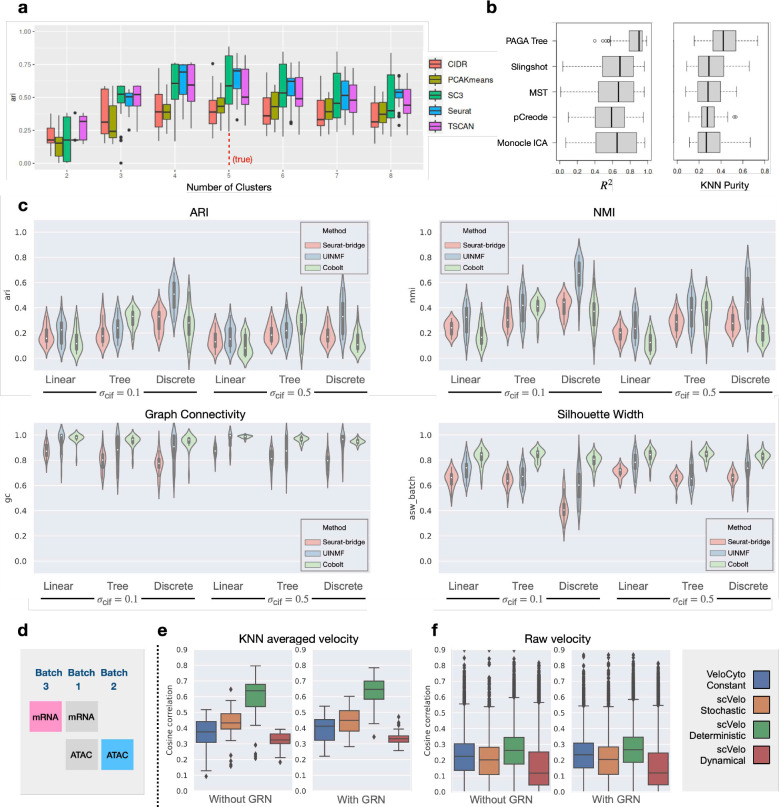
Figure 4. Benchmarking clustering, trajectory inference, multi-modal data integration and RNA velocity estimation methods.
(a) Benchmarking clustering methods on dataset MD (discrete). Methods are grouped by number of clusters in the result. The vertical red dashed line shows the true number of clusters. A higher ARI indicates better clustering. (b) Benchmarking trajectory inference methods on dataset MT (continuous tree). Methods are evaluated based on their mean R2 and kNN purity on each lineage (higher is better). (c) Benchmarking multi-modal data integration methods. Metrics for the methods: ARI, NMI (higher = better at preserving cell identities), graph connectivity and average silhouette width of batch (higher = better merging batches). (d) The task illustration of multi-modal data integration. Only cells in batch 1 and 3 (pink and blue matrices) are used for evaluation. (e,f) Benchmarking RNA velocity estimation methods on auxiliary dataset V. The result is measured using cosine similarity.

