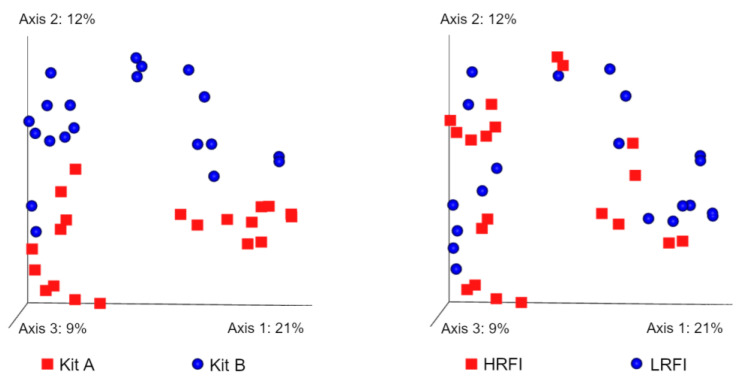
Figure 6.
Principal coordinate analysis (PCoA) plots showing Bray–Curtis distances. The separation of samples based on the DNA extraction method is much more evident compared to the separation of samples based on RFI levels. The strong effect of DNA extraction method was also observed in other beta diversity metrics.

