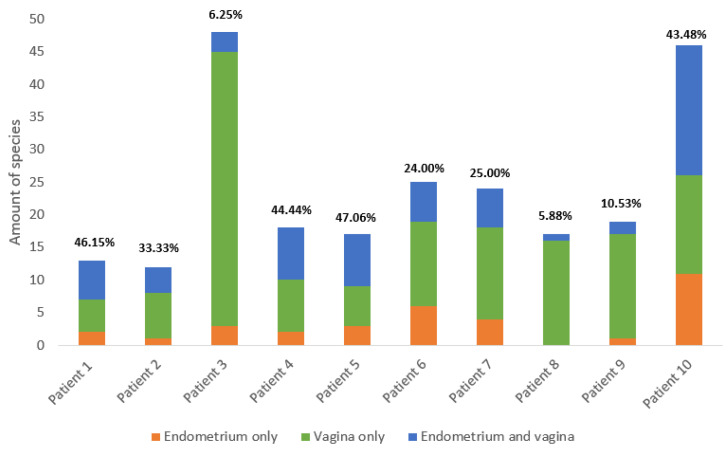
Figure 3.
Summary of the number of species in the vagina and endometrium across all 10 patients. The proportion of species identified only in the endometrium is colored orange, the proportion identified only in the vagina is colored green, and the proportion identified in both vagina and endometrium is colored blue. The concordance ((species found in both vagina and endometrium/all species found) * 100) of species between the vaginal and endometrial microbiota is given above the corresponding bars. Detailed information per patient is available in the Supplementary Materials.

