
Fig. 3. Effects of volinanserin on LSD-induced HTR (a,b) and ICSS depression in rats (c,d).
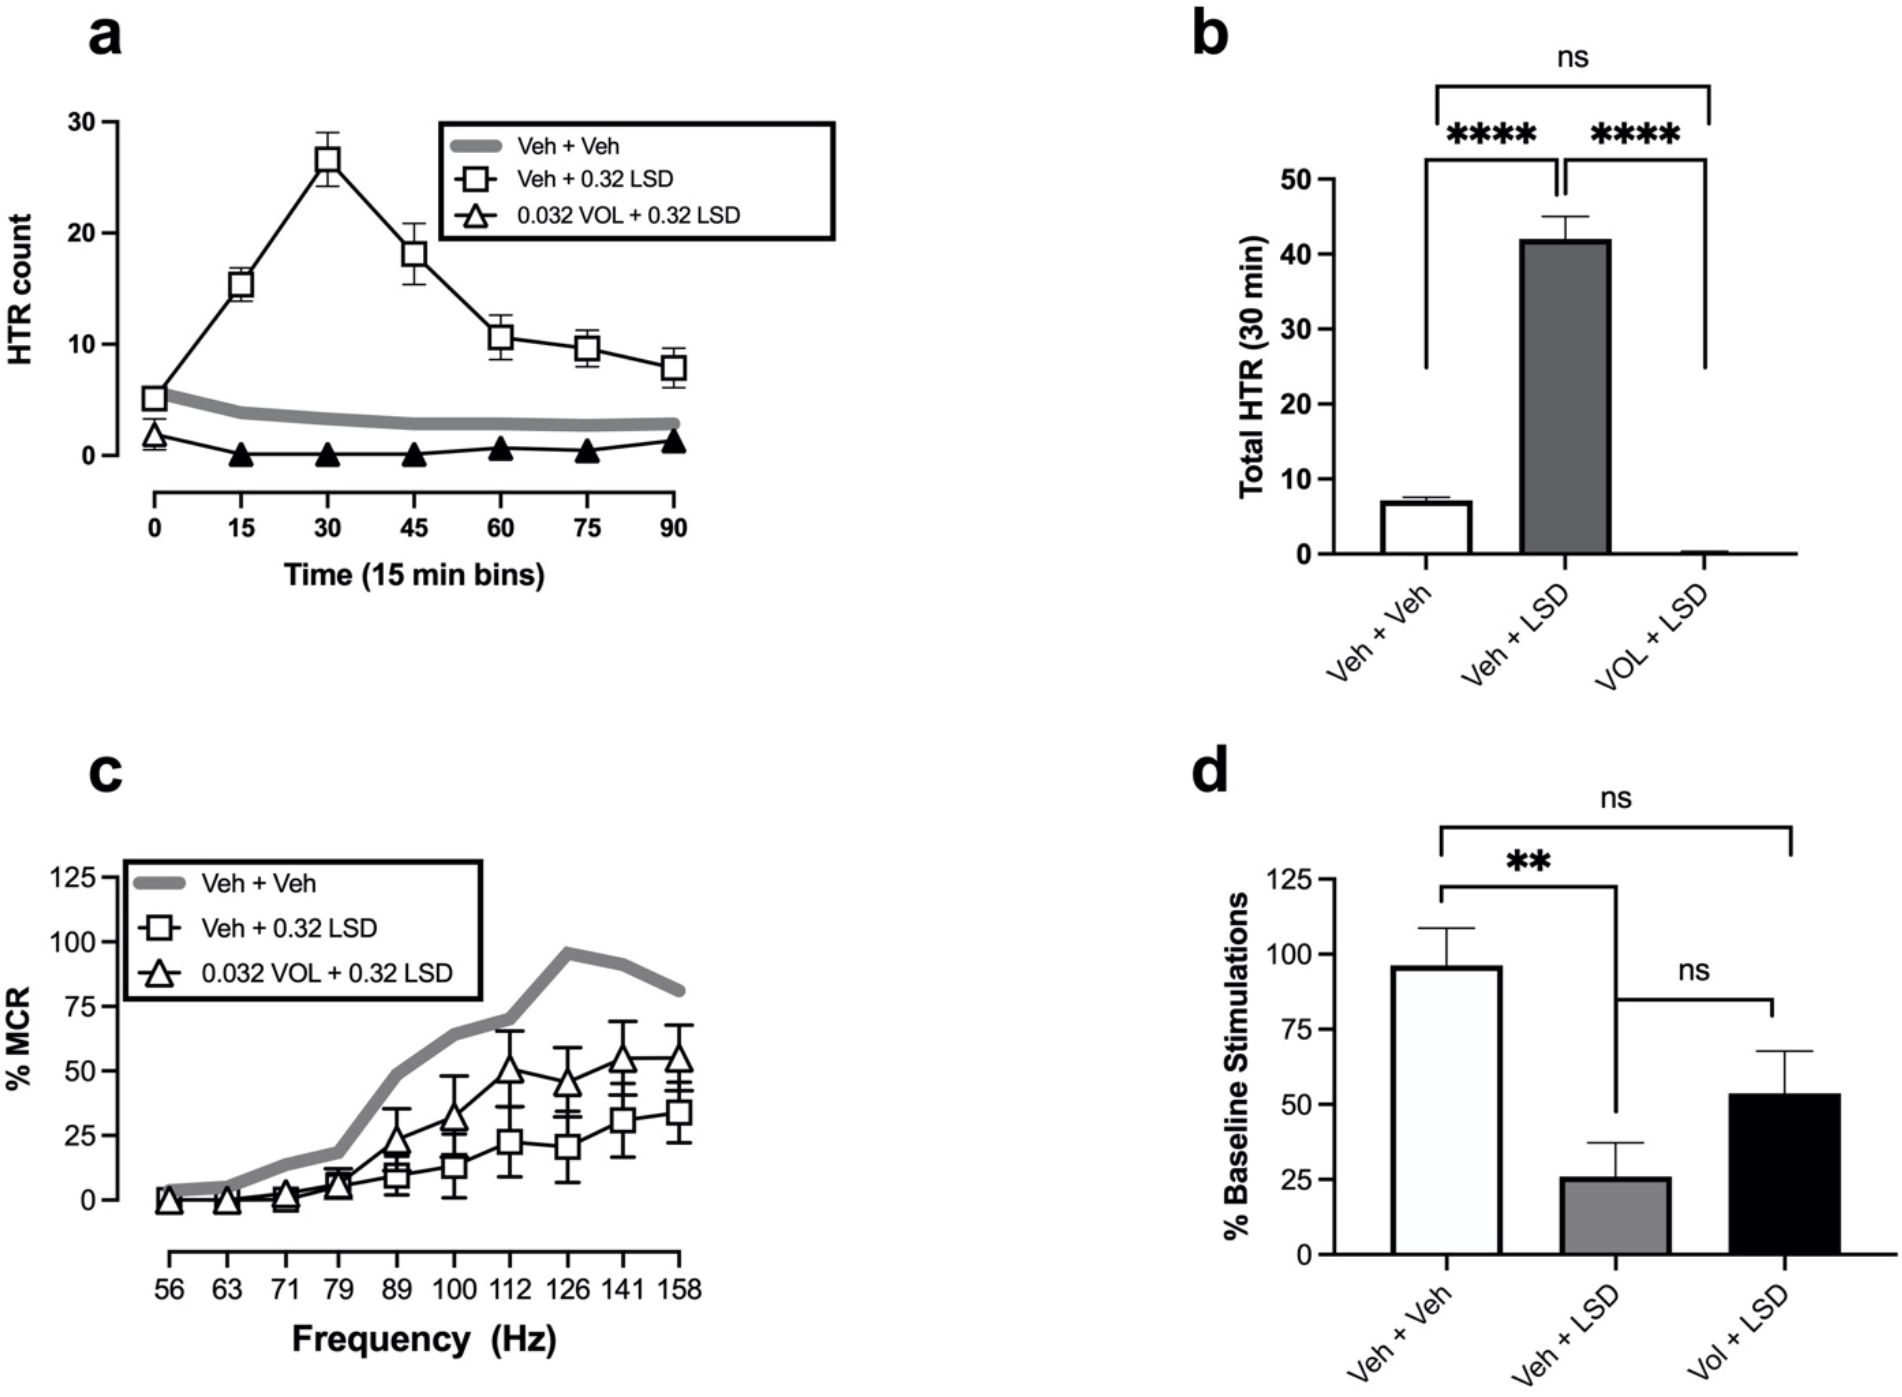
a) Time-course of HTR as head twitch response (frequency of head twitches) over time split into 15-minute bins. RM two-way ANOVA followed Holm-Šidak post hoc: effect of time (F [2.469, 49.39] = 18.06; p<0.0001), treatment (F [2, 20] = 58.96; p<0.0001) and time × treatment (F [10, 100] = 20.53; p<0.0001). Filled symbols indicate difference from VEH + LSD, p<0.05. b) Total HTR collapsed into the 30-minute peak effect following 0.032 mg/kg volinanserin + 0.32 mg/kg LSD. One-way ANOVA: treatment effect (F [2,21] = 165.4; p<0.0001) followed Holm-Šidak post hoc. c) Full frequency-rate curves for treatments shown as % Maximum Control Rate (%MCR) and frequency of electrical brain stimulation in Hz (log scale). RM two-way ANOVA: effect of frequency (F [9,45] = 8.144; p<0.0001), treatment (F [1,5] = 2.455; p>0.05), and frequency × treatment (F [9,45] = 1.747; p>0.05). Filled symbols indicate significant different from VEH + LSD at the designated brain-stimulation frequency, p<0.05. d) % Baseline Stimulations per Component on the ordinates as a function of treatment with Vehicle/ 0.032 mg/kg Volinanserin + Vehicle/ 0.32 mg/kg LSD. RM one-way ANOVA: treatment effect (F [1.511, 7.554] =11.12, p<0.01). **p<0.01, ****p<0.0001, n.s., not significant. All points show mean ± SEM for N=8 mice (a,b) mean ± SEM for N=6 rats (c,d).