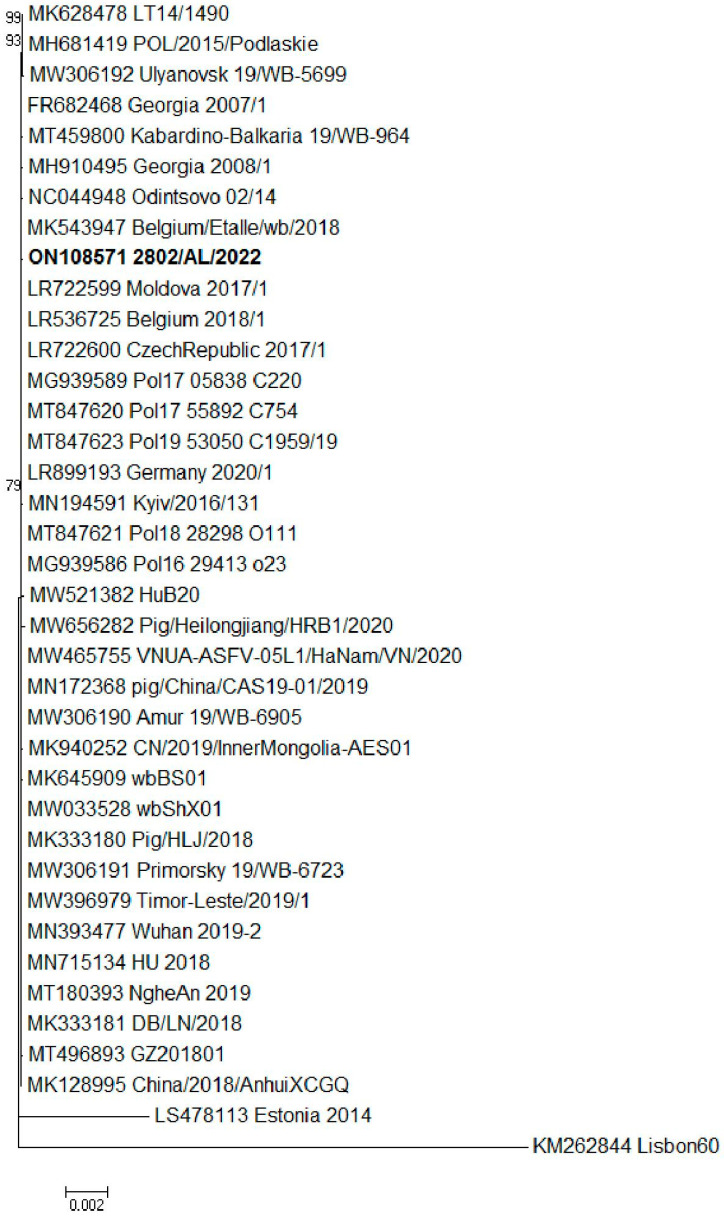
Figure 2.
Maximum likelihood (ML) phylogenetic tree of 36 ASFV complete genome sequences. The sample ON108571 2802/AL/2022 characterized in this study is shown in bold. Bootstrap values > 70 are indicated at their respective nodes. Bars indicate the number of nucleotide substitutions per site.

