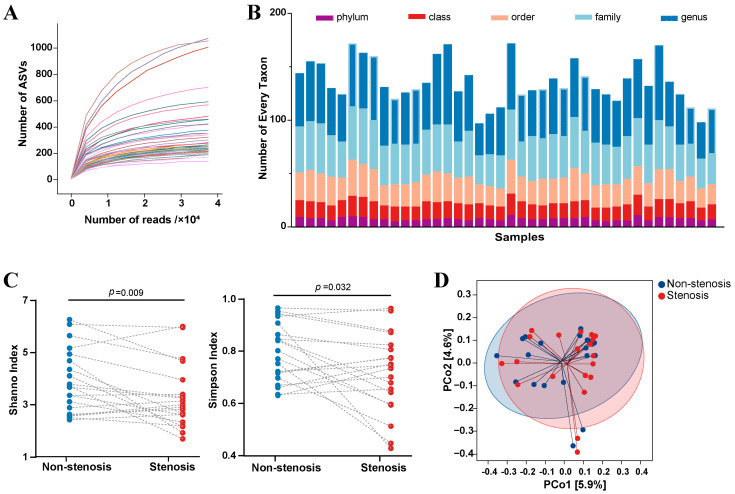
Figure 1.
Mucosa-associated microbiota variations between intestinal stenotic and non-stenotic sites in CD. (A): Dilution curve representing the relationship between number of gene reads and amplicon sequence variants. Every curve represents a sample; (B): Number of different taxonomic levels in every sample; (C): Alpha diversity variations in different sites of every patient; (D): Principal Coordinates Analysis between samples from stenotic and non-stenotic sites.

