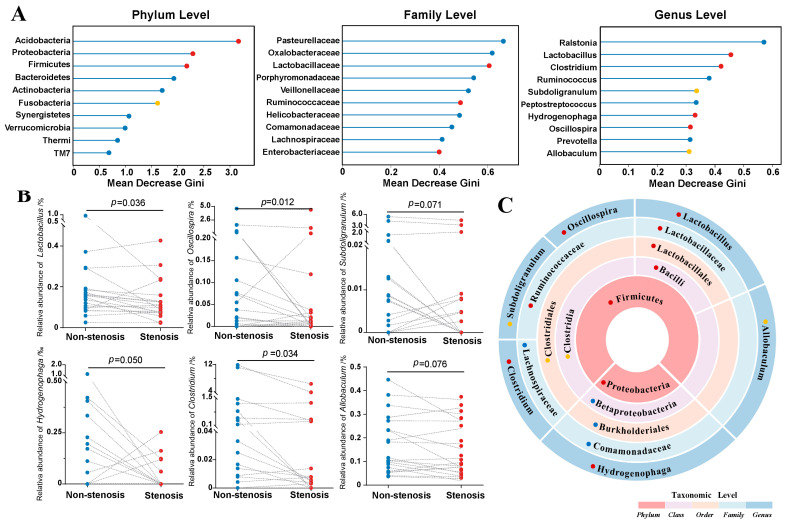
Figure 2.
Taxonomic differences between intestinal stenotic and non-stenotic sites in CD. (A): Random forest analysis to identify distinguishing microbes at different taxonomic levels. The x-axis presented the contribution of each taxon to the microbial heterogeneity between stenotic and non-stenotic sites (shown by the mean decrease Gini index when the corresponding taxon was removed from the analysis model). (B): Bacterial abundance alterations in different sites of every patient. (C): Biological relationship of distinguishing taxonomic levels. Statistical results of relative abundance variation between two sites for the corresponding taxon: ● p < 0.05; ● 0.05 < p < 0.1; ● p > 0.1.

