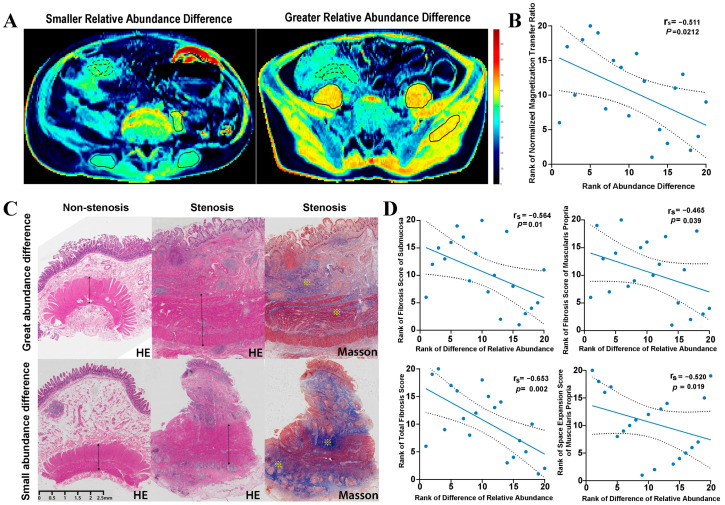
Figure 4.
Correlations between Genus Oscillospira sp. abundance difference (stenotic site vs. non-stenotic site) and the degree of intestinal fibrosis. Patients with great and small Oscillospira sp. abundance differences were presented respectively. (A): Representative illustration showed the measurement of the normalized MT ratio of the affected bowel wall. Tissues with high MT ratios (such as skeletal muscle) appear yellow-red, while tissues with low MT ratios (such as subcutaneous fat) are dark blue. Normalized MT ratio of bowel wall was measured as MT ratios of the bowel wall (delineated by  )/MT ratios of muscle (delineated by
  ); (B): Spearman’s rank correlation analysis between Oscillospira sp. abundance difference and normalized MT ratio of bowel wall; (C). Representative intestinal histopathological characteristics of stenotic and non-stenotic sites in the same patient. ↔ indicated space volume of muscularis propria layer; ※ indicated increased collagen deposition in submucosa and muscularis propria layers. (D): Spearman’s rank correlation analysis between Oscillospira sp. abundance difference and fibrosis score and space volume expansion score.

