. 2023 Feb 21;14(13):3531–3540. doi: 10.1039/d2sc06861c

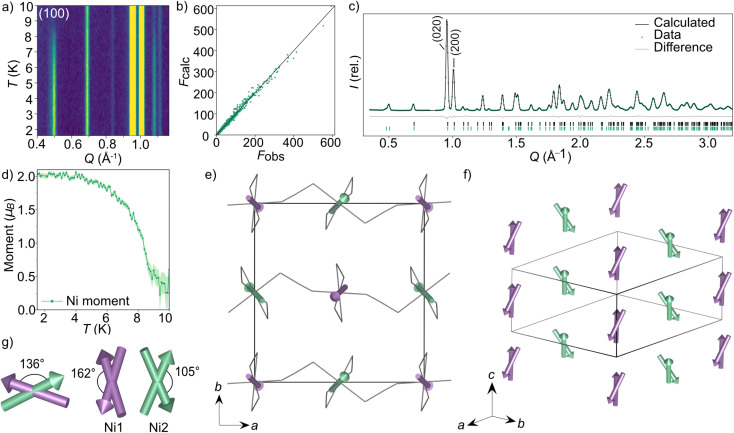
Fig. 3. Neutron diffraction data and the magnetic structure for CsNi(NCS)3. (a) Thermodiffractogram measured between 1.5 and 10 K on the D1b diffractometer (ILL). The most intense magnetic Bragg reflection is indexed as the (100) planes. The Fobs against Fcalc plot obtained from D19 data fit (nuclear and magnetic) collected at 1.8 K (b) and Rietveld fit obtained from D1b data fit at 1.5 K (c) for the multi pattern refinement of the P21/c magnetic model describing the magnetic structure of CsNi(NCS)3. (d) The magnetic moment of the Ni2+ ions as a function of temperature obtained by Rietveld refinements of the data collected at each temperature point between 1.5 and 10 K. (e) The magnetic structure of CsNi(NCS)3 viewed down the c axis. The two unique magnetic vectors are represented with purple arrows (Ni1) and green arrows (Ni2). The Cs+ cations have been omitted for clarity and the thiocyanate ligands are represented as a wire frame. (f) The magnetic structure viewed down the [111] direction. (g) Angles describing the non-collinearity of the moments.

Fig. 3