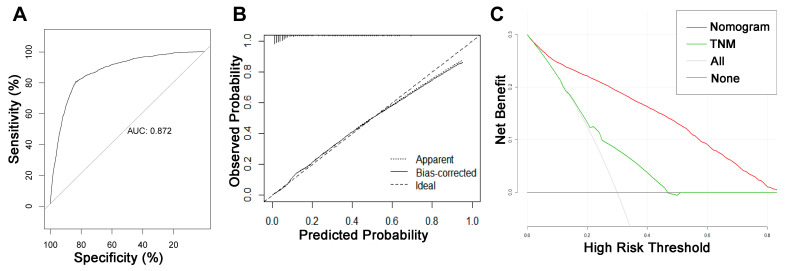
Figure 2.
ROC curve, calibration curve, and decision curve analysis of the nomogram model for the risk of liver metastasis in pancreatic cancer. (A) AUC values were used to evaluate the predictive performance of the nomogram. (B) Calibration curves of the nomogram model. The diagonal 45-degree line indicates a perfect prediction. (C) Comparison of the diagnostic nomograms and TNM staging DCA curves. The net benefit, calculated by adding the true positives minus the false positives, corresponds to the measurement on the Y-axis; the X-axis represents the threshold probability.

